Heidelberg Cement (MYSCEM) - ICICI Direct
Heidelberg Cement (MYSCEM) - ICICI Direct
Heidelberg Cement (MYSCEM) - ICICI Direct

You also want an ePaper? Increase the reach of your titles
YUMPU automatically turns print PDFs into web optimized ePapers that Google loves.
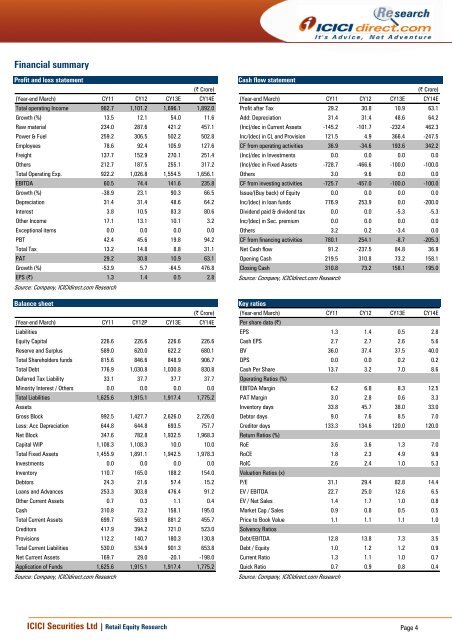
Financial summaryProfit and loss statement(| Crore)(Year-end March) CY11 CY12 CY13E CY14ETotal operating Income 982.7 1,101.2 1,696.1 1,892.0Growth (%) 13.5 12.1 54.0 11.6Raw material 234.0 287.6 421.2 457.1Power & Fuel 259.2 306.5 502.2 502.8Employees 78.6 92.4 105.9 127.6Freight 137.7 152.9 270.1 251.4Others 212.7 187.5 255.1 317.2Total Operating Exp. 922.2 1,026.8 1,554.5 1,656.1EBITDA 60.5 74.4 141.6 235.8Growth (%) -38.9 23.1 90.3 66.5Depreciation 31.4 31.4 48.6 64.2Interest 3.8 10.5 83.3 80.6Other Income 17.1 13.1 10.1 3.2Exceptional items 0.0 0.0 0.0 0.0PBT 42.4 45.6 19.8 94.2Total Tax 13.2 14.8 8.8 31.1PAT 29.2 30.8 10.9 63.1Growth (%) -53.9 5.7 -64.5 476.8EPS (|) 1.3 1.4 0.5 2.8Source: Company, <strong>ICICI</strong>direct.com ResearchBalance sheet(| Crore)(Year-end March) CY11 CY12P CY13E CY14ELiabilitiesEquity Capital 226.6 226.6 226.6 226.6Reserve and Surplus 589.0 620.0 622.2 680.1Total Shareholders funds 815.6 846.6 848.9 906.7Total Debt 776.9 1,030.8 1,030.8 830.8Deferred Tax Liability 33.1 37.7 37.7 37.7Minority Interest / Others 0.0 0.0 0.0 0.0Total Liabilities 1,625.6 1,915.1 1,917.4 1,775.2AssetsGross Block 992.5 1,427.7 2,626.0 2,726.0Less: Acc Depreciation 644.8 644.8 693.5 757.7Net Block 347.6 782.8 1,932.5 1,968.3Capital WIP 1,108.3 1,108.3 10.0 10.0Total Fixed Assets 1,455.9 1,891.1 1,942.5 1,978.3Investments 0.0 0.0 0.0 0.0Inventory 110.7 165.0 188.2 154.0Debtors 24.3 21.6 57.4 15.2Loans and Advances 253.3 303.8 476.4 91.2Other Current Assets 0.7 0.3 1.1 0.4Cash 310.8 73.2 158.1 195.0Total Current Assets 699.7 563.9 881.2 455.7Creditors 417.9 394.2 721.0 523.0Provisions 112.2 140.7 180.3 130.8Total Current Liabilities 530.0 534.9 901.3 653.8Net Current Assets 169.7 29.0 -20.1 -198.0Application of Funds 1,625.6 1,915.1 1,917.4 1,775.2Source: Company, <strong>ICICI</strong>direct.com ResearchCash flow statement(| Crore)(Year-end March) CY11 CY12 CY13E CY14EProfit after Tax 29.2 30.8 10.9 63.1Add: Depreciation 31.4 31.4 48.6 64.2(Inc)/dec in Current Assets -145.2 -101.7 -232.4 462.3Inc/(dec) in CL and Provision 121.5 4.9 366.4 -247.5CF from operating activities 36.9 -34.6 193.6 342.2(Inc)/dec in Investments 0.0 0.0 0.0 0.0(Inc)/dec in Fixed Assets -728.7 -466.6 -100.0 -100.0Others 3.0 9.6 0.0 0.0CF from investing activities -725.7 -457.0 -100.0 -100.0Issue/(Buy back) of Equity 0.0 0.0 0.0 0.0Inc/(dec) in loan funds 776.9 253.9 0.0 -200.0Dividend paid & dividend tax 0.0 0.0 -5.3 -5.3Inc/(dec) in Sec. premium 0.0 0.0 0.0 0.0Others 3.2 0.2 -3.4 0.0CF from financing activities 780.1 254.1 -8.7 -205.3Net Cash flow 91.2 -237.5 84.8 36.9Opening Cash 219.5 310.8 73.2 158.1Closing Cash 310.8 73.2 158.1 195.0Source: Company, <strong>ICICI</strong>direct.com ResearchKey ratios(Year-end March) CY11 CY12 CY13E CY14EPer share data (|)EPS 1.3 1.4 0.5 2.8Cash EPS 2.7 2.7 2.6 5.6BV 36.0 37.4 37.5 40.0DPS 0.0 0.0 0.2 0.2Cash Per Share 13.7 3.2 7.0 8.6Operating Ratios (%)EBITDA Margin 6.2 6.8 8.3 12.5PAT Margin 3.0 2.8 0.6 3.3Inventory days 33.8 45.7 38.0 33.0Debtor days 9.0 7.6 8.5 7.0Creditor days 133.3 134.6 120.0 120.0Return Ratios (%)RoE 3.6 3.6 1.3 7.0RoCE 1.8 2.3 4.9 9.9RoIC 2.6 2.4 1.0 5.3Valuation Ratios (x)P/E 31.1 29.4 82.8 14.4EV / EBITDA 22.7 25.0 12.6 6.5EV / Net Sales 1.4 1.7 1.0 0.8Market Cap / Sales 0.9 0.8 0.5 0.5Price to Book Value 1.1 1.1 1.1 1.0Solvency RatiosDebt/EBITDA 12.8 13.8 7.3 3.5Debt / Equity 1.0 1.2 1.2 0.9Current Ratio 1.3 1.1 1.0 0.7Quick Ratio 0.7 0.9 0.8 0.4Source: Company, <strong>ICICI</strong>direct.com Research<strong>ICICI</strong> Securities Ltd | Retail Equity Research Page 4