Annual Report 2010/2011 - pdf 7.05 MB - Nobina AB
Annual Report 2010/2011 - pdf 7.05 MB - Nobina AB
Annual Report 2010/2011 - pdf 7.05 MB - Nobina AB

You also want an ePaper? Increase the reach of your titles
YUMPU automatically turns print PDFs into web optimized ePapers that Google loves.
MArKet OVerVIeW<br />
» Bus transport accounted for about 59%<br />
of total public transport and increased<br />
slightly during <strong>2010</strong>.<br />
The trend throughout the Nordic region is<br />
toward more incentive-driven contracts,<br />
which will increase travel and make it profitable<br />
to offer public transport. And as more<br />
traffic areas are opened up for competition,<br />
the price scenario will improve and benefit<br />
the traffic companies that can deliver high<br />
quality for a good price.<br />
TRAVEl IN THE NORDIc cOuNTRIEs<br />
Travel is increasing in Sweden and this is true<br />
for both car travel and public transport. Bus<br />
traffic accounted for approximately 59% of<br />
total public transport, up 0.4% during <strong>2010</strong>.<br />
That can be compared with the subway, which<br />
accounted for approximately 27% and trains<br />
for approximately 14% of trips.<br />
In Norway, the number of travelers using<br />
public transport increased by 1.3% during<br />
<strong>2010</strong>, which corresponded to developments<br />
during 2009, according to the Statistics<br />
Norway. The largest growth occurred in<br />
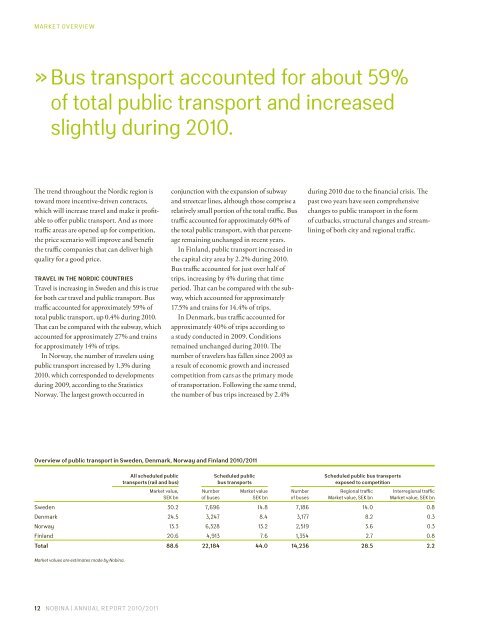
Overview of public transport in sweden, Denmark, Norway and Finland <strong>2010</strong>/<strong>2011</strong><br />
All scheduled public<br />
transports (rail and bus)<br />
12 NOBINA | ANNuAl repOrt <strong>2010</strong>/<strong>2011</strong><br />
Market value,<br />
SeK bn<br />
Number<br />
of buses<br />
scheduled public<br />
bus transports<br />
Market value<br />
SeK bn<br />
Number<br />
of buses<br />
scheduled public bus transports<br />
exposed to competition<br />
regional traffic<br />
Market value, SeK bn<br />
Interregional traffic<br />
Market value, SeK bn<br />
Sweden 30.2 7,696 14.8 7,186 14.0 0.8<br />
Denmark 24.5 3,247 8.4 3,177 8.2 0.3<br />
Norway 13.3 6,328 13.2 2,519 3.6 0.3<br />
Finland 20.6 4,913 7.6 1,354 2.7 0.8<br />
Total 88.6 22,184 44.0 14,236 28.5 2.2<br />
Market values are estimates made by <strong>Nobina</strong>.<br />
conjunction with the expansion of subway<br />
and streetcar lines, although those comprise a<br />
relatively small portion of the total traffic. Bus<br />
traffic accounted for approximately 60% of<br />
the total public transport, with that percentage<br />
remaining unchanged in recent years.<br />
In Finland, public transport increased in<br />
the capital city area by 2.2% during <strong>2010</strong>.<br />
Bus traffic accounted for just over half of<br />
trips, increasing by 4% during that time<br />
period. That can be compared with the subway,<br />
which accounted for approximately<br />
17.5% and trains for 14.4% of trips.<br />
In Denmark, bus traffic accounted for<br />
approximately 40% of trips according to<br />
a study conducted in 2009. Conditions<br />
remained unchanged during <strong>2010</strong>. The<br />
number of travelers has fallen since 2003 as<br />
a result of economic growth and increased<br />
competition from cars as the primary mode<br />
of transportation. Following the same trend,<br />
the number of bus trips increased by 2.4%<br />
during <strong>2010</strong> due to the financial crisis. The<br />
past two years have seen comprehensive<br />
changes to public transport in the form<br />
of cutbacks, structural changes and streamlining<br />
of both city and regional traffic.