Mission Statement: The Coca-Cola Company exists to ... - Webs
Mission Statement: The Coca-Cola Company exists to ... - Webs
Mission Statement: The Coca-Cola Company exists to ... - Webs

Create successful ePaper yourself
Turn your PDF publications into a flip-book with our unique Google optimized e-Paper software.
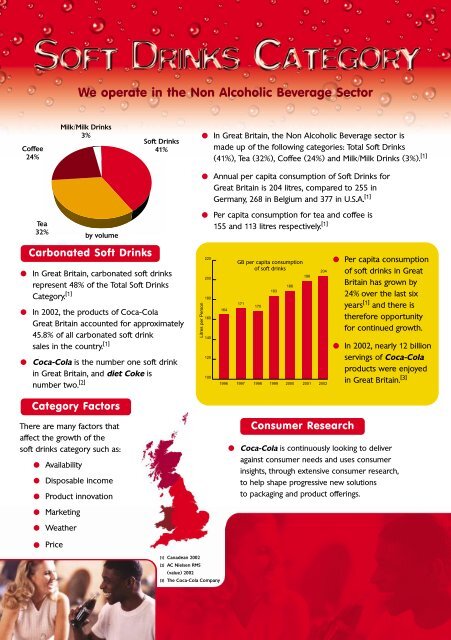
Coffee<br />
24%<br />
Tea<br />
32%<br />
Carbonated Soft Drinks<br />
• In Great Britain, carbonated soft drinks<br />
represent 48% of the Total Soft Drinks<br />
Category. [1]<br />
• In 2002, the products of <strong>Coca</strong>-<strong>Cola</strong><br />
Great Britain accounted for approximately<br />
45.8% of all carbonated soft drink<br />
sales in the country. [1]<br />
• <strong>Coca</strong>-<strong>Cola</strong> is the number one soft drink<br />
in Great Britain, and diet Coke is<br />
number two. [2]<br />
<strong>The</strong>re are many fac<strong>to</strong>rs that<br />
affect the growth of the<br />
soft drinks category such as:<br />
•<br />
Availability<br />
•<br />
Disposable income<br />
Product innovation<br />
• Marketing<br />
• Weather<br />
• Price<br />
Milk/Milk Drinks<br />
3%<br />
by volume<br />
Category Fac<strong>to</strong>rs<br />
We operate in the Non Alcoholic Beverage Sec<strong>to</strong>r<br />
Soft Drinks<br />
41%<br />
[1] Canadean 2002<br />
• In<br />
Litres per Person<br />
• Annual<br />
• Per<br />
220<br />
200<br />
180<br />
160<br />
140<br />
120<br />
100<br />
[2] AC Nielsen RMS<br />
(value) 2002<br />
[3] <strong>The</strong> <strong>Coca</strong>-<strong>Cola</strong> <strong>Company</strong><br />
Great Britain, the Non Alcoholic Beverage sec<strong>to</strong>r is<br />
made up of the following categories: Total Soft Drinks<br />
(41%), Tea (32%), Coffee (24%) and Milk/Milk Drinks (3%). [1]<br />
per capita consumption of Soft Drinks for<br />
Great Britain is 204 litres, compared <strong>to</strong> 255 in<br />
Germany, 268 in Belgium and 377 in U.S.A. [1]<br />
capita consumption for tea and coffee is<br />
155 and 113 litres respectively. [1]<br />
164<br />
1996<br />
• <strong>Coca</strong>-<strong>Cola</strong><br />
GB per capita consumption<br />
of soft drinks<br />
171<br />
170<br />
183<br />
188<br />
198<br />
204<br />
1997 1998 1999 2000 2001 2002<br />
• Per<br />
• In<br />
Consumer Research<br />
capita consumption<br />
of soft drinks in Great<br />
Britain has grown by<br />
24% over the last six<br />
years [1] and there is<br />
therefore opportunity<br />
for continued growth.<br />
2002, nearly 12 billion<br />
servings of <strong>Coca</strong>-<strong>Cola</strong><br />
products were enjoyed<br />
in Great Britain. [3]<br />
is continuously looking <strong>to</strong> deliver<br />
against consumer needs and uses consumer<br />
insights, through extensive consumer research,<br />
<strong>to</strong> help shape progressive new solutions<br />
<strong>to</strong> packaging and product offerings.