Chapter 21 Resource: Ecology
Chapter 21 Resource: Ecology
Chapter 21 Resource: Ecology
- No tags were found...

You also want an ePaper? Increase the reach of your titles
YUMPU automatically turns print PDFs into web optimized ePapers that Google loves.
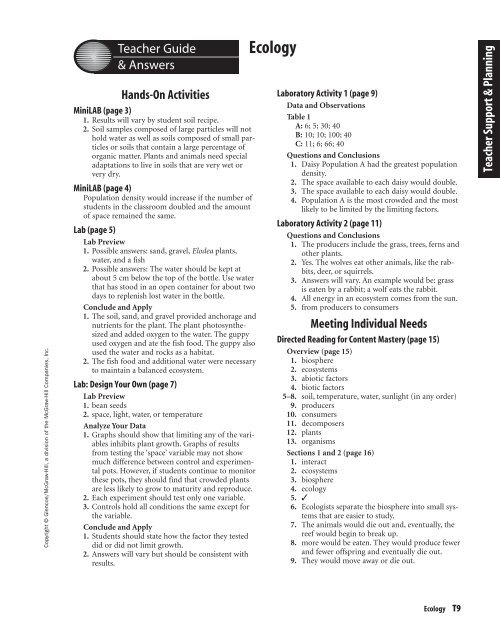
Copyright © Glencoe/McGraw-Hill, a division of the McGraw-Hill Companies, Inc.Teacher Guide& AnswersHands-On ActivitiesMiniLAB (page 3)1. Results will vary by student soil recipe.2. Soil samples composed of large particles will nothold water as well as soils composed of small particlesor soils that contain a large percentage oforganic matter. Plants and animals need specialadaptations to live in soils that are very wet orvery dry.MiniLAB (page 4)Population density would increase if the number ofstudents in the classroom doubled and the amountof space remained the same.Lab (page 5)Lab Preview1. Possible answers: sand, gravel, Elodea plants,water, and a fish2. Possible answers: The water should be kept atabout 5 cm below the top of the bottle. Use waterthat has stood in an open container for about twodays to replenish lost water in the bottle.Conclude and Apply1. The soil, sand, and gravel provided anchorage andnutrients for the plant. The plant photosynthesizedand added oxygen to the water. The guppyused oxygen and ate the fish food. The guppy alsoused the water and rocks as a habitat.2. The fish food and additional water were necessaryto maintain a balanced ecosystem.Lab: Design Your Own (page 7)Lab Preview1. bean seeds2. space, light, water, or temperatureAnalyze Your Data1. Graphs should show that limiting any of the variablesinhibits plant growth. Graphs of resultsfrom testing the ‘space’ variable may not showmuch difference between control and experimentalpots. However, if students continue to monitorthese pots, they should find that crowded plantsare less likely to grow to maturity and reproduce.2. Each experiment should test only one variable.3. Controls hold all conditions the same except forthe variable.Conclude and Apply1. Students should state how the factor they testeddid or did not limit growth.2. Answers will vary but should be consistent withresults.<strong>Ecology</strong>Laboratory Activity 1 (page 9)Data and ObservationsTable 1A: 6; 5; 30; 40B: 10; 10; 100; 40C: 11; 6; 66; 40Questions and Conclusions1. Daisy Population A had the greatest populationdensity.2. The space available to each daisy would double.3. The space available to each daisy would double.4. Population A is the most crowded and the mostlikely to be limited by the limiting factors.Laboratory Activity 2 (page 11)Questions and Conclusions1. The producers include the grass, trees, ferns andother plants.2. Yes. The wolves eat other animals, like the rabbits,deer, or squirrels.3. Answers will vary. An example would be: grassis eaten by a rabbit; a wolf eats the rabbit.4. All energy in an ecosystem comes from the sun.5. from producers to consumersMeeting Individual NeedsDirected Reading for Content Mastery (page 15)Overview (page 15)1. biosphere2. ecosystems3. abiotic factors4. biotic factors5–8. soil, temperature, water, sunlight (in any order)9. producers10. consumers11. decomposers12. plants13. organismsSections 1 and 2 (page 16)1. interact2. ecosystems3. biosphere4. ecology5. ✓6. Ecologists separate the biosphere into small systemsthat are easier to study.7. The animals would die out and, eventually, thereef would begin to break up.8. more would be eaten. They would produce fewerand fewer offspring and eventually die out.9. They would move away or die out.Teacher Support & Planning<strong>Ecology</strong>T9