LOANS AND NON-PERFORMING LOANS (NPLs)As <strong>of</strong> December 31, 2011Table 13(millions <strong>of</strong> KHR)Dec-11Dec-10Loans 1 NPLs NPL/Loans Loans 1 NPLs NPL/LoansCommercial <strong>Bank</strong>s1 Acleda <strong>Bank</strong> Plc. 4,102,821 7,299 0.18% 3,047,511 13,599 0.4%2 Canadia <strong>Bank</strong> Plc. 3,079,009 131,061 4.26% 2,140,373 140,095 6.5%3 <strong>Cambodia</strong>n Public <strong>Bank</strong> Plc 2,484,017 89,715 3.61% 2,326,613 78,293 3.4%4 ANZ Royal <strong>Bank</strong> (<strong>Cambodia</strong>) Ltd. 1,332,837 50,520 3.79% 1,193,835 68,079 5.7%5 <strong>Bank</strong> for Investment & Development <strong>of</strong> <strong>Cambodia</strong> Plc 1,156,250 360 0.03% 606,506 - 0.0%6 May <strong>Bank</strong>, Phnom Penh Branch* 682,814 24,616 3.61% 367,835 14,815 4.0%7 Foreign Trade <strong>Bank</strong> <strong>of</strong> <strong>Cambodia</strong> 608,553 17,263 2.84% 527,311 17,030 3.2%8 Union Commercial <strong>Bank</strong> Plc. 589,874 2,593 0.44% 361,091 247 0.1%9 Advanced <strong>Bank</strong> <strong>of</strong> Asia Ltd. 379,903 13,652 3.59% 302,097 2,359 0.8%10 First Commercial <strong>Bank</strong>, Phnom Penh Branch* 379,811 4,226 1.11% 303,650 - 0.0%11 Vattanac <strong>Bank</strong> Ltd. 343,242 - 0.00% 230,171 32,381 14.1%12 OSK Indochina <strong>Bank</strong> 233,588 799 0.34% 113,346 393 0.3%13 Saigon Thuong Tin (<strong>Cambodia</strong>) Plc 229,563 160 0.07% 281,742 - 0.0%14 Phnom Penh Commercial <strong>Bank</strong> 174,337 - 0.00% 96,667 - 0.0%15 CIMB <strong>Bank</strong> 171,925 - 0.00% - - 0.0%16 Shinhan Khmer <strong>Bank</strong> 153,058 - 0.00% 125,767 - 0.0%17 <strong>Cambodia</strong> Asia <strong>Bank</strong> Ltd. 142,366 2,020 1.42% 99,437 - 0.0%18 Singapore <strong>Bank</strong>ing Corporation 138,281 1,893 1.37% 107,766 329 0.3%19 Maruhan Japan <strong>Bank</strong> Plc. 133,163 10,187 7.65% 56,971 - 0.0%20 <strong>Cambodia</strong>n Commercial <strong>Bank</strong> Ltd. 126,722 - 0.00% 142,633 - 0.0%21 Krung Thai <strong>Bank</strong> Public Co. Ltd., P.P. Branch* 112,006 593 0.53% 101,887 - 0.0%22 Kookmin <strong>Bank</strong> <strong>Cambodia</strong> Plc 3 101,414 6,601 6.51% 66,230 - 0.0%23 <strong>Cambodia</strong> Mekong <strong>Bank</strong> Public Ltd. 87,481 22,701 25.95% 78,885 20,316 25.8%24 Agri <strong>Bank</strong> <strong>Cambodia</strong> Branch* 78,057 - 0.00% 56,030 - 0.0%25 Hwang DBS Commercial <strong>Bank</strong> Plc 75,668 112 0.15% 26,457 474 1.8%26 <strong>Bank</strong> <strong>of</strong> China Phnom Penh Branch* 24,626 - 0.00% - - -27 <strong>Bank</strong> <strong>of</strong> India Phnom Penh Branch* 16,769 - 0.00% 5,757 - 0.0%28 Booyoung Khmer <strong>Bank</strong> - - 0.00% 1,668 897 53.8%Sub total 17,138,155 386,371 2.25% 12,768,235 389,305 3.0%Specialized <strong>Bank</strong>s29 Rural Development <strong>Bank</strong> 130,811 591 0.45% 110,127 593 0.5%30 Angkor Capital Specialized <strong>Bank</strong> 51,319 16,976 33.08% 67,028 89 0.1%31 CAMKO Specialized <strong>Bank</strong> Ltd. 44,259 888 2.01% 85,515 - 0.0%32 Anco Specialized <strong>Bank</strong> 39,261 14,614 37.22% 37,173 7,532 20.3%33 First Investment Specialized <strong>Bank</strong> 24,327 1,589 6.53% 20,790 2,709 13.0%34 PHSME Specialized <strong>Bank</strong> 24,102 2,053 8.52% 23,084 342 1.5%35 Tomato Specialized <strong>Bank</strong> 22,143 1,600 7.23% 21,828 - 0.0%Sub total 336,222 38,311 11.39% 365,544 11,265 3.1%* Foreign branches1 Gross Loans (excluding loans to government and banks)Note: As reported by banks (Unaudited) and excluded Mega <strong>Bank</strong>*, ICBC*, MB*17,474,377 424,682 2.43% 13,133,779 400,570 3.0%Loans and Non-Performing Loans (NPLs)Billions <strong>of</strong> KHR20,00018,00016,00014,00012,00010,0008,0006,0004,0002,000-9.5%7.5%2,4113,5796,3353.4% 3.7%9,80410,46713,13517,474180 340 218 360 457 401 4254.4%3.0%2.43%2005 2006 2007 2008 2009 2010 201110.0%9.0%8.0%7.0%6.0%5.0%4.0%3.0%2.0%1.0%0.0%Loans NPLs NPLs/Loans-23-
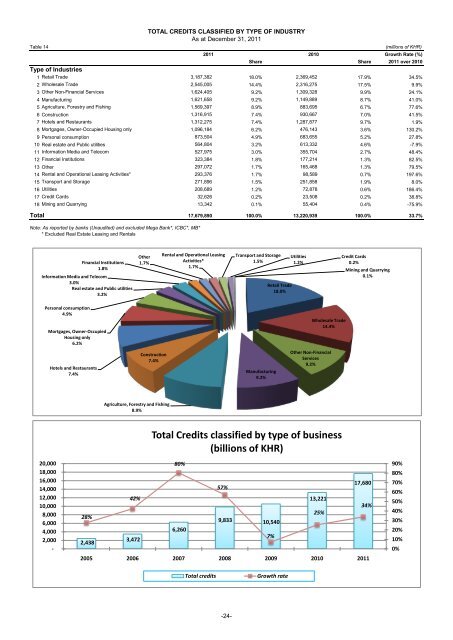
Table 14(millions <strong>of</strong> KHR)2011 2010 Growth Rate (%)Share Share 2011 over 2010Type <strong>of</strong> Industries1 Retail Trade 3,187,382 18.0% 2,369,452 17.9% 34.5%2 Wholesale Trade 2,545,005 14.4% 2,316,275 17.5% 9.9%3 Other Non-Financial Services 1,624,405 9.2% 1,309,328 9.9% 24.1%4 Manufacturing 1,621,658 9.2% 1,149,889 8.7% 41.0%5 Agriculture, Forestry and Fishing 1,569,397 8.9% 883,695 6.7% 77.6%6 Construction 1,316,915 7.4% 930,667 7.0% 41.5%7 Hotels and Restaurants 1,312,275 7.4% 1,287,877 9.7% 1.9%8 Mortgages, Owner-Occupied Housing only 1,096,184 6.2% 476,143 3.6% 130.2%9 Personal consumption 873,504 4.9% 683,655 5.2% 27.8%10 Real estate and Public utilities 564,804 3.2% 613,332 4.6% -7.9%11 Information Media and Telecom 527,975 3.0% 355,704 2.7% 48.4%12 Financial Institutions 323,384 1.8% 177,214 1.3% 82.5%13 Other 297,072 1.7% 165,468 1.3% 79.5%14 Rental and Operational Leasing Activities* 293,376 1.7% 98,589 0.7% 197.6%15 Transport and Storage 271,896 1.5% 251,858 1.9% 8.0%16 Utilities 208,689 1.2% 72,878 0.6% 186.4%17 Credit Cards 32,626 0.2% 23,508 0.2% 38.8%18 Mining and Quarrying 13,342 0.1% 55,404 0.4% -75.9%Total 17,679,890 100.0% 13,220,939 100.0% 33.7%Note: As reported by banks (Unaudited) and excluded Mega <strong>Bank</strong>*, ICBC*, MB** Excluded Real Estate Leasing and RentalsTOTAL CREDITS CLASSIFIED BY TYPE OF INDUSTRYAs at December 31, 2011Financial Institutions1.8%Information Media and Telecom3.0%Real estate and Public utilities3.2%Other1.7%Rental and Operational LeasingActivities*1.7%Transport and Storage1.5%Retail Trade18.0%Utilities1.2%Credit Cards0.2%Mining and Quarrying0.1%Personal consumption4.9%Mortgages, Owner-OccupiedHousing only6.2%Wholesale Trade14.4%Hotels and Restaurants7.4%Construction7.4%Manufacturing9.2%Other Non-FinancialServices9.2%Agriculture, Forestry and Fishing8.9%Total Credits classified by type <strong>of</strong> business(billions <strong>of</strong> KHR)20,000Services18,000 Whole sale and Retail16,000 Manufacturing14,000 Real estate and Public utilities12,000 ConstructionAgriculture10,000Import8,00028%Personal 6,000 consumptionOther 4,0002,000 2,438-42%3,47280%6,26057%9,833 10,5407%13,22125%17,6802005 2006 2007 2008 2009 2010 201134%90%80%70%60%50%40%30%20%10%0%Total creditsGrowth rate-24-