Table 15TOTAL CREDITS CLASSIFIED BY TYPE OF BUSINESSAs at December 31, 2011(millions <strong>of</strong> KHR)TotalFinancialInstitutionsAgriculture,Forestry andFishingMining andQuarryingUtilitiesManufacturingConstructionWholesaleTradeRetail TradeHotels andRestaurantsTransportandStorageInformationmedia &Telecom.Rental andOperationalLeasingActivitiesRealEstateActivitiesOther Non-FinancialServicesPersonalEssentialsOtherLendingCommercial banks1 ACLEDA <strong>Bank</strong> 4,102,821 17,060 674,444 - 187,173 - - 646,908 1,011,163 55,803 - - - 25,218 782,392 625,662 77,0002 Canadia <strong>Bank</strong> Ltd. 3,081,029 14,835 265,811 5,234 230,397 23,028 204,556 384,989 610,103 450,668 30,506 140,026 141,421 58,623 71,565 449,268 -3 <strong>Cambodia</strong>n Public <strong>Bank</strong> Plc 2,484,017 7,465 51,845 1,794 272,186 13,699 307,668 188,229 611,485 393,623 108,853 27,847 89,743 105,344 104,925 194,984 4,3264 ANZ Royal <strong>Cambodia</strong> 1,332,837 7,466 2,080 2,273 171,848 1,255 30,393 542,317 40,347 17,714 43,296 204,856 571 31,314 16,670 220,435 -5 BIDC 1,156,250 - 133,702 2,198 216,829 31,326 123,557 99,396 210,138 3,882 29,114 50,917 - 56,178 - 73,472 125,5406 Foreign Trade <strong>Bank</strong> <strong>of</strong> <strong>Cambodia</strong> 696,471 84,323 115,803 - 32,867 24,254 25,282 18,926 58,274 - - - - - 322,989 13,753 -7 May <strong>Bank</strong> 682,814 16,821 35,579 - 118,633 16,487 52,535 84,657 42,057 4,958 7,145 1,586 - 121,519 13,260 166,951 6268 Union Commercial <strong>Bank</strong> Plc. 589,874 24,839 15,853 - 88,416 28,006 159,919 79,325 65,408 31,145 494 10,708 6,152 37,911 13,738 22,780 5,1809 Advanced <strong>Bank</strong> <strong>of</strong> Asia Ltd. 379,903 - 9,617 1,273 25,633 1,146 18,988 17,525 76,926 34,752 2,069 14,220 1,218 4,058 93,506 78,974 -10 First Commercial <strong>Bank</strong> 379,811 - 5,534 - 54,683 - 29,952 119,601 18,239 25,587 2,690 1,423 - 15,301 87,724 4,040 15,03711 Vattanac <strong>Bank</strong> 343,242 - 13,735 - 43,348 - 55,315 58,691 51,787 54,774 20,614 - 1,865 13,892 24,771 4,275 17412 OSK Indochina <strong>Bank</strong> 233,588 851 3,363 - 37,244 173 9,151 8,264 52,359 64,164 3,813 3,287 22,593 - 3,788 24,538 -13 Saigon Thuong Tin (<strong>Cambodia</strong>) Plc 229,563 - - - 40,779 406 19,003 51,682 53,145 6,934 6,494 122 - - - 3,732 47,26614 Maruhan Japan <strong>Bank</strong> Plc. 198,663 65,582 26,558 - 7,175 4,018 21,260 40,401 298 30,523 1,514 - 632 - - 703 -15 Phnom Penh Commercial <strong>Bank</strong> 175,905 6,060 1,686 - 18,866 543 25,268 23,026 36,792 27,486 3,439 - 14,395 9,543 3,880 4,879 4116 CIMB <strong>Bank</strong> Plc. 171,925 3,881 - - 5,657 - 14,344 22,227 18,175 13,959 3,351 23,603 - 36,411 10,259 20,059 -17 Shinhan Khmer <strong>Bank</strong> 153,058 - 11,968 569 33,754 844 29,665 11,307 7,126 32,369 5,034 805 - - 17,630 1,988 -18 <strong>Cambodia</strong> Asia <strong>Bank</strong> Ltd. 142,366 - - - - - 131,875 - - - - - - - - 10,490 -19 Singapore <strong>Bank</strong>ing Corporation Ltd. 138,281 1,794 224 - 8,012 3,896 10,501 242 98,369 101 2,855 - - - - 6,854 5,43220 <strong>Cambodia</strong>n Commercial <strong>Bank</strong> Ltd. 126,722 - - - - - 807 - 88,526 33,754 - - - - 2,984 652 -21 Krung Thai <strong>Bank</strong> Public Co. Ltd. 112,006 - 48,478 - 1,091 36,399 14,524 10,171 1,344 - - - - - - - -22 KOOKMIN <strong>Bank</strong> <strong>Cambodia</strong> Plc. 101,414 - 11,531 - - - 5,409 38,062 - 6,747 - - - 14,955 24,709 - -23 <strong>Cambodia</strong> Mekong <strong>Bank</strong> Ltd. 87,481 - 9,115 - 4,118 18,700 145 10,233 964 2,215 - - - 18,026 20,595 1,426 1,94524 AGRI <strong>Bank</strong> <strong>Cambodia</strong> Branch 78,057 - 3,433 - 6,467 - 6,719 11,306 - 6,177 71 40,437 - - - 3,435 1225 HwangDBS 75,667 2,423 562 - 495 146 1,631 6,965 8,188 5,658 503 967 10,429 3,555 79 19,573 14,49226 <strong>Bank</strong> <strong>of</strong> India Phnom Penh Branch 56,743 39,973 4,050 - 5,604 121 2,816 2,290 - - - - - - - 1,887 -27 <strong>Bank</strong> <strong>of</strong> China Phnom Penh Branch 24,626 - - - 5,447 - - 14,954 - - - - - - 4,225 - -28 Booyoung Khmer <strong>Bank</strong> - - - - - - - - - - - - - - - - -Sub total 17,335,136 293,374 1,444,971 13,342 1,616,723 204,448 1,301,283 2,491,694 3,161,212 1,302,992 271,858 520,802 289,020 551,847 1,619,688 1,954,809 297,072Specialized banks29 Rural Development <strong>Bank</strong> 139,343 28,430 108,205 - - 30 - - - - - - - - - 2,679 -30 Angkor Capital Specialized <strong>Bank</strong> 51,319 - - - - - - 51,319 - - - - - - - - -31 CAMKO Specialized <strong>Bank</strong> Ltd. 44,259 - - - - - 3,479 - - - - - - 8,923 124 31,734 -32 ANCO Specialized <strong>Bank</strong> 39,261 1,016 11,543 - 893 3,421 1,224 - 7,740 5,281 - - - 906 - 7,237 -33 First Investment Specialized <strong>Bank</strong> 24,327 - 1,335 - 1,581 140 3,103 326 3,763 1,165 38 7,172 - - 1,007 4,698 -34 PHSME Specialized <strong>Bank</strong> Ltd. 24,102 442 1,327 - 2,151 651 5,671 - 6,687 37 - - 87 3,128 3,545 376 -35 Tomato Specialized <strong>Bank</strong> 22,143 122 2,017 - 311 - 2,156 1,666 7,980 2,800 - - 4,269 - 41 782 -Sub total 344,754 30,010 124,426 - 4,935 4,241 15,632 53,311 26,171 9,284 38 7,172 4,356 12,957 4,717 47,505 -Total17,679,890 323,384 1,569,397 13,342 1,621,658 208,689 1,316,915 2,545,005 3,187,382 1,312,275 271,896 527,975 293,376 564,804 1,624,405 2,002,314 297,072* Foreign branchesNote: As reported by banks (Unaudited) and excluded Mega <strong>Bank</strong>*, ICBC*, MB*100.0% 1.8% 8.9% 0.1% 9.2% 1.2% 7.4% 14.4% 18.0% 7.4% 1.5% 3.0% 1.7% 3.2% 9.2% 11.3% 1.7%-25-
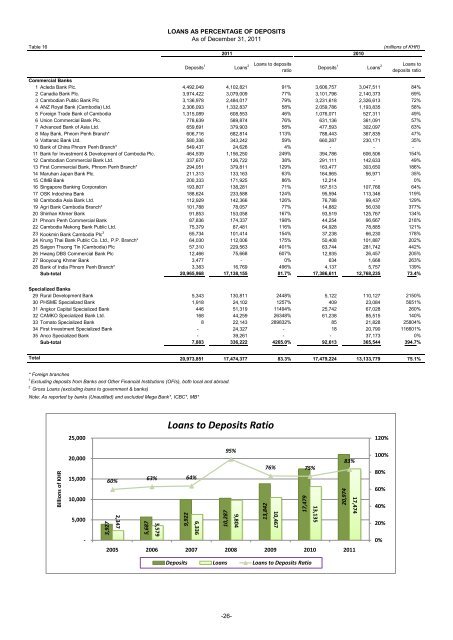
Table 16LOANS AS PERCENTAGE OF DEPOSITSAs <strong>of</strong> December 31, 20112011 2010(millions <strong>of</strong> KHR)Deposits 1 Loans 2 Loans to depositsratioDeposits 1 Loans 2 Loans todeposits ratioCommercial <strong>Bank</strong>s1 Acleda <strong>Bank</strong> Plc. 4,492,049 4,102,821 91% 3,606,757 3,047,511 84%2 Canadia <strong>Bank</strong> Plc. 3,974,422 3,079,009 77% 3,101,796 2,140,373 69%3 <strong>Cambodia</strong>n Public <strong>Bank</strong> Plc 3,136,978 2,484,017 79% 3,231,618 2,326,613 72%4 ANZ Royal <strong>Bank</strong> (<strong>Cambodia</strong>) Ltd. 2,306,093 1,332,837 58% 2,059,786 1,193,835 58%5 Foreign Trade <strong>Bank</strong> <strong>of</strong> <strong>Cambodia</strong> 1,315,089 608,553 46% 1,076,071 527,311 49%6 Union Commercial <strong>Bank</strong> Plc. 778,639 589,874 76% 631,136 361,091 57%7 Advanced <strong>Bank</strong> <strong>of</strong> Asia Ltd. 659,691 379,903 58% 477,593 302,097 63%8 May <strong>Bank</strong>, Phnom Penh Branch* 606,716 682,814 113% 788,443 367,835 47%9 Vattanac <strong>Bank</strong> Ltd. 580,336 343,242 59% 660,287 230,171 35%10 <strong>Bank</strong> <strong>of</strong> China Phnom Penh Branch* 549,437 24,626 4% - - -11 <strong>Bank</strong> for Investment & Development <strong>of</strong> <strong>Cambodia</strong> Plc. 464,539 1,156,250 249% 394,786 606,506 154%12 <strong>Cambodia</strong>n Commercial <strong>Bank</strong> Ltd. 337,670 126,722 38% 291,111 142,633 49%13 First Commercial <strong>Bank</strong>, Phnom Penh Branch* 294,051 379,811 129% 163,477 303,650 186%14 Maruhan Japan <strong>Bank</strong> Plc. 211,313 133,163 63% 164,965 56,971 35%15 CIMB <strong>Bank</strong> 200,333 171,925 86% 12,214 - 0%16 Singapore <strong>Bank</strong>ing Corporation 193,807 138,281 71% 167,513 107,766 64%17 OSK Indochina <strong>Bank</strong> 188,624 233,588 124% 95,594 113,346 119%18 <strong>Cambodia</strong> Asia <strong>Bank</strong> Ltd. 112,929 142,366 126% 76,788 99,437 129%19 Agri <strong>Bank</strong> <strong>Cambodia</strong> Branch* 101,788 78,057 77% 14,882 56,030 377%20 Shinhan Khmer <strong>Bank</strong> 91,853 153,058 167% 93,519 125,767 134%21 Phnom Penh Commercial <strong>Bank</strong> 87,836 174,337 198% 44,254 96,667 218%22 <strong>Cambodia</strong> Mekong <strong>Bank</strong> Public Ltd. 75,379 87,481 116% 64,928 78,885 121%23 Kookmin <strong>Bank</strong> <strong>Cambodia</strong> Plc 3 65,734 101,414 154% 37,238 66,230 178%24 Krung Thai <strong>Bank</strong> Public Co. Ltd., P.P. Branch* 64,030 112,006 175% 50,408 101,887 202%25 Saigon Thuong Tin (<strong>Cambodia</strong>) Plc 57,310 229,563 401% 63,744 281,742 442%26 Hwang DBS Commercial <strong>Bank</strong> Plc 12,466 75,668 607% 12,935 26,457 205%27 Booyoung Khmer <strong>Bank</strong> 3,477 - 0% 634 1,668 263%28 <strong>Bank</strong> <strong>of</strong> India Phnom Penh Branch* 3,383 16,769 496% 4,137 5,757 139%Sub-total 20,965,968 17,138,155 81.7% 17,386,611 12,768,235 73.4%Specialized <strong>Bank</strong>s29 Rural Development <strong>Bank</strong> 5,343 130,811 2448% 5,122 110,127 2150%30 PHSME Specialized <strong>Bank</strong> 1,918 24,102 1257% 409 23,084 5651%31 Angkor Capital Specialized <strong>Bank</strong> 446 51,319 11494% 25,742 67,028 260%32 CAMKO Specialized <strong>Bank</strong> Ltd. 168 44,259 26348% 61,238 85,515 140%33 Tomato Specialized <strong>Bank</strong> 8 22,143 289832% 85 21,828 25804%34 First Investment Specialized <strong>Bank</strong> - 24,327 - 18 20,790 116601%35 Anco Specialized <strong>Bank</strong> - 39,261 - - 37,173 0%Sub-total 7,883 336,222 4265.0% 92,613 365,544 394.7%Total 20,973,851 17,474,377 83.3% 17,479,224 13,133,779 75.1%* Foreign branches1 Excluding deposits from <strong>Bank</strong>s and Other Financial Institutions (OFIs), both local and abroad.2 Gross Loans (excluding loans to government & banks)Note: As reported by banks (Unaudited) and excluded Mega <strong>Bank</strong>*, ICBC*, MB*Loans to Deposits Ratio25,000120%Billions <strong>of</strong> KHR20,00015,00010,0005,000-3,92760%2,3475,68763% 64%3,5799,9226,33610,28795%9,80413,84276% 75%10,46717,47913,13520,97483%17,474100%80%60%40%20%0%2005 2006 2007 2008 2009 2010 2011Deposits Loans Loans to Deposits Ratio-26-