Energias do Brasil SA and subsidiaries - EDP no Brasil | Investidores
Energias do Brasil SA and subsidiaries - EDP no Brasil | Investidores
Energias do Brasil SA and subsidiaries - EDP no Brasil | Investidores

Create successful ePaper yourself
Turn your PDF publications into a flip-book with our unique Google optimized e-Paper software.
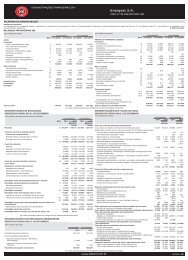
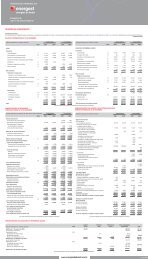
<strong>EDP</strong> – ENERGIAS DO BRASIL S.A.<br />
STATEMENT OF ADDED VALUES<br />
YEARS ENDED DECEMBER 31, 2009 AND 2008<br />
(Amounts expressed in thous<strong>and</strong>s of Reais, unless otherwise indicated)<br />
Parent company Consolidated<br />
2009 2008 2009 2008<br />
Generation of value added 50,253<br />
(410) 7,014,402 6,890,690<br />
Operating revenue 6,995,633 6,953,014<br />
Allowance for <strong>do</strong>ubtful accounts <strong>and</strong> net losses (36,680) (70,916)<br />
Other revenue 50,253<br />
(410)<br />
55,449<br />
8,592<br />
(–) Inputs acquired from third parties (63,529) (36,623) (2,933,566) (2,886,019)<br />
Costs of purchased energy (1,924,113) (1,909,517)<br />
Use charges of distribution <strong>and</strong> transmission system (511,641) (466,999)<br />
Materials (617)<br />
(483)<br />
(24,236) (46,670)<br />
Third-party services (28,667) (29,333)<br />
(284,527) (328,059)<br />
Other operating costs (34,245) (6,807)<br />
(189,049) (134,774)<br />
Gross value added (13,276) (37,033) 4,080,836 4,004,671<br />
Depreciation <strong>and</strong> amortization (21,770) (148,449)<br />
(303,961) (446,646)<br />
Net generated value added (35,046) (185,482) 3,776,875 3,558,025<br />
Financial revenues 95,556 27,064<br />
279,275 223,942<br />
Mi<strong>no</strong>rity interest (160,267) (102,998)<br />
Equity accounting result 638,309 604,463<br />
(1,742)<br />
Total value added to distribute<br />
Distribution of value added<br />
698,819 446,045<br />
3,894,141 3,678,969<br />
Employees 21,283 14,341<br />
226,406 245,207<br />
Payroll 12,437 8,182<br />
157,760 180,574<br />
Benefits 7,076 4,985<br />
47,685 44,727<br />
F.G.T.S. 1,770 1,174<br />
20,961 19,906<br />
Taxes, fees <strong>and</strong> contributions 16,655 16,192<br />
2,646,316 2,631,973<br />
Federal 16,655 16,192<br />
1,418,222 1,395,379<br />
State 1,223,423 1,229,628<br />
Municipal 4,671<br />
6,966<br />
Remuneration own capital 37,054 27,183<br />
380,510 406,539<br />
Interest 34,275 24,749<br />
371,677 396,348<br />
Rents 2,779 2,434<br />
8,833 10,191<br />
Remuneration own capital 296,317 237,271<br />
312,089 243,742<br />
Interest on equity 103,061<br />
103,061<br />
Dividends 296,317 134,210<br />
296,317 134,210<br />
Founders' shares 15,772<br />
6,471<br />
371,309 294,987<br />
3,565,321 3,527,461<br />
Income for the year after dividends 327,510 151,058<br />
328,820 151,508<br />
698,819 446,045<br />
3,894,141 3,678,969<br />
See the accompanying <strong>no</strong>tes to the financial statements<br />
34