FSBstats: A First Look
FSBstats: A First Look
FSBstats: A First Look
- No tags were found...
Create successful ePaper yourself
Turn your PDF publications into a flip-book with our unique Google optimized e-Paper software.
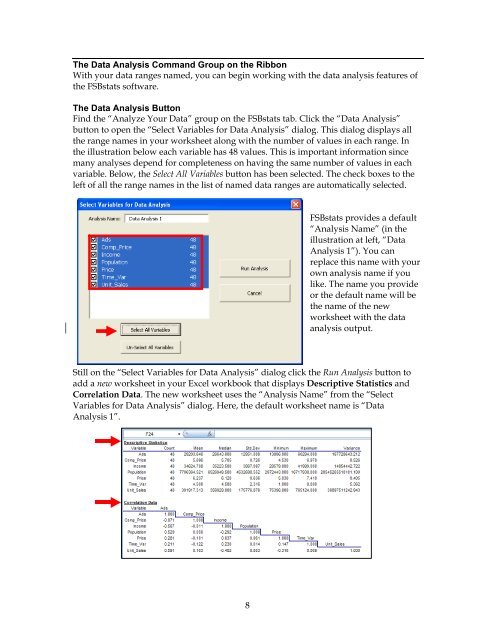
The Data Analysis Command Group on the RibbonWith your data ranges named, you can begin working with the data analysis features ofthe <strong>FSBstats</strong> software.The Data Analysis ButtonFind the “Analyze Your Data” group on the <strong>FSBstats</strong> tab. Click the “Data Analysis”button to open the “Select Variables for Data Analysis” dialog. This dialog displays allthe range names in your worksheet along with the number of values in each range. Inthe illustration below each variable has 48 values. This is important information sincemany analyses depend for completeness on having the same number of values in eachvariable. Below, the Select All Variables button has been selected. The check boxes to theleft of all the range names in the list of named data ranges are automatically selected.<strong>FSBstats</strong> provides a default“Analysis Name” (in theillustration at left, “DataAnalysis 1”). You canreplace this name with yourown analysis name if youlike. The name you provideor the default name will bethe name of the newworksheet with the dataanalysis output.Still on the “Select Variables for Data Analysis” dialog click the Run Analysis button toadd a new worksheet in your Excel workbook that displays Descriptive Statistics andCorrelation Data. The new worksheet uses the “Analysis Name” from the “SelectVariables for Data Analysis” dialog. Here, the default worksheet name is “DataAnalysis 1”.8


