FSBstats: A First Look
FSBstats: A First Look
FSBstats: A First Look
- No tags were found...

You also want an ePaper? Increase the reach of your titles
YUMPU automatically turns print PDFs into web optimized ePapers that Google loves.
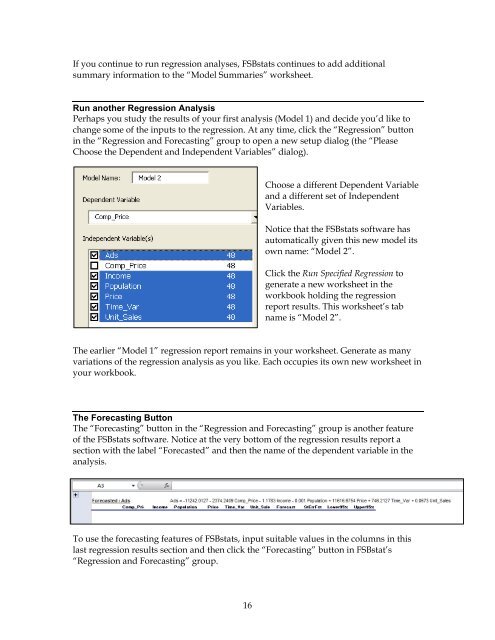
If you continue to run regression analyses, <strong>FSBstats</strong> continues to add additionalsummary information to the “Model Summaries” worksheet.Run another Regression AnalysisPerhaps you study the results of your first analysis (Model 1) and decide you’d like tochange some of the inputs to the regression. At any time, click the “Regression” buttonin the “Regression and Forecasting” group to open a new setup dialog (the “PleaseChoose the Dependent and Independent Variables” dialog).Choose a different Dependent Variableand a different set of IndependentVariables.Notice that the <strong>FSBstats</strong> software hasautomatically given this new model itsown name: “Model 2”.Click the Run Specified Regression togenerate a new worksheet in theworkbook holding the regressionreport results. This worksheet’s tabname is “Model 2”.The earlier “Model 1” regression report remains in your worksheet. Generate as manyvariations of the regression analysis as you like. Each occupies its own new worksheet inyour workbook.The Forecasting ButtonThe “Forecasting” button in the “Regression and Forecasting” group is another featureof the <strong>FSBstats</strong> software. Notice at the very bottom of the regression results report asection with the label “Forecasted” and then the name of the dependent variable in theanalysis.To use the forecasting features of <strong>FSBstats</strong>, input suitable values in the columns in thislast regression results section and then click the “Forecasting” button in FSBstat’s“Regression and Forecasting” group.16