FSBstats: A First Look
FSBstats: A First Look
FSBstats: A First Look
- No tags were found...

You also want an ePaper? Increase the reach of your titles
YUMPU automatically turns print PDFs into web optimized ePapers that Google loves.
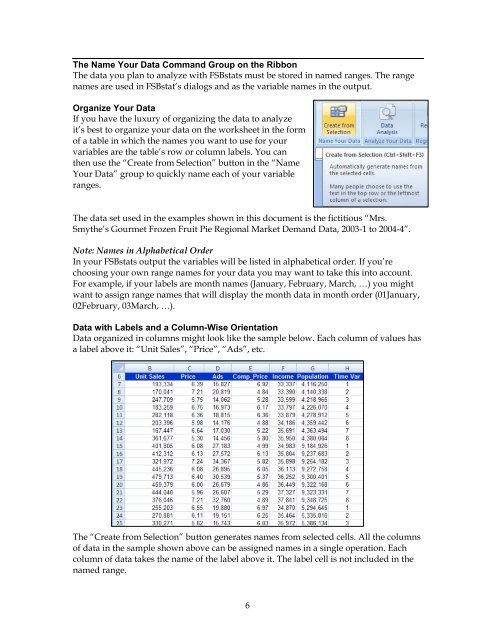
The Name Your Data Command Group on the RibbonThe data you plan to analyze with <strong>FSBstats</strong> must be stored in named ranges. The rangenames are used in FSBstat’s dialogs and as the variable names in the output.Organize Your DataIf you have the luxury of organizing the data to analyzeit’s best to organize your data on the worksheet in the formof a table in which the names you want to use for yourvariables are the table’s row or column labels. You canthen use the “Create from Selection” button in the “NameYour Data” group to quickly name each of your variableranges.The data set used in the examples shown in this document is the fictitious “Mrs.Smythe’s Gourmet Frozen Fruit Pie Regional Market Demand Data, 2003-1 to 2004-4”.Note: Names in Alphabetical OrderIn your <strong>FSBstats</strong> output the variables will be listed in alphabetical order. If you’rechoosing your own range names for your data you may want to take this into account.For example, if your labels are month names (January, February, March, …) you mightwant to assign range names that will display the month data in month order (01January,02February, 03March, …).Data with Labels and a Column-Wise OrientationData organized in columns might look like the sample below. Each column of values hasa label above it: “Unit Sales”, “Price”, “Ads”, etc.The “Create from Selection” button generates names from selected cells. All the columnsof data in the sample shown above can be assigned names in a single operation. Eachcolumn of data takes the name of the label above it. The label cell is not included in thenamed range.6