FSBstats: A First Look
FSBstats: A First Look
FSBstats: A First Look
- No tags were found...

You also want an ePaper? Increase the reach of your titles
YUMPU automatically turns print PDFs into web optimized ePapers that Google loves.
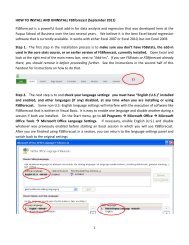
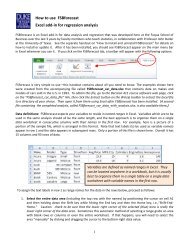
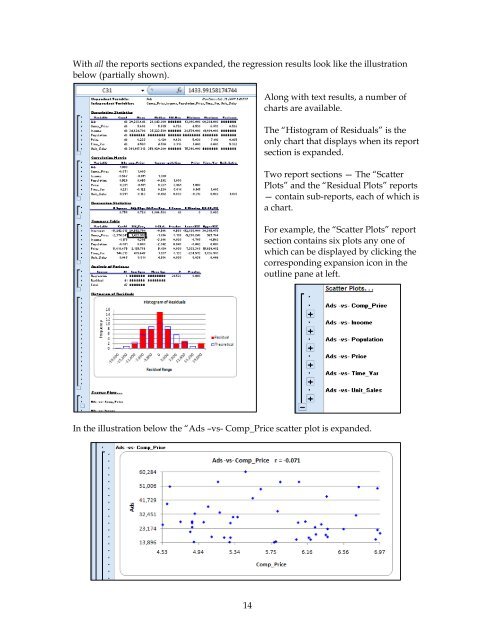
With all the reports sections expanded, the regression results look like the illustrationbelow (partially shown).Along with text results, a number ofcharts are available.The “Histogram of Residuals” is theonly chart that displays when its reportsection is expanded.Two report sections — The “ScatterPlots” and the “Residual Plots” reports— contain sub-reports, each of which isa chart.For example, the “Scatter Plots” reportsection contains six plots any one ofwhich can be displayed by clicking thecorresponding expansion icon in theoutline pane at left.In the illustration below the “Ads –vs- Comp_Price scatter plot is expanded.14