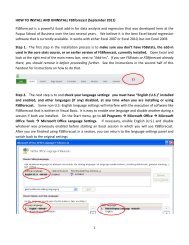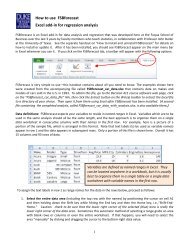
FSBstats: A First Look
FSBstats: A First Look
FSBstats: A First Look
- No tags were found...

You also want an ePaper? Increase the reach of your titles
YUMPU automatically turns print PDFs into web optimized ePapers that Google loves.
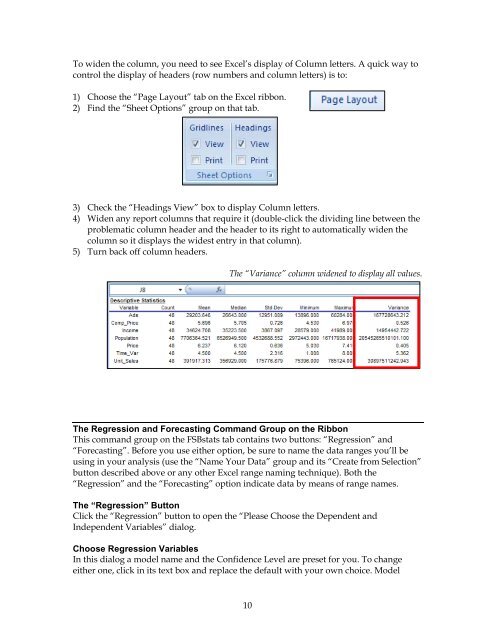
To widen the column, you need to see Excel’s display of Column letters. A quick way tocontrol the display of headers (row numbers and column letters) is to:1) Choose the “Page Layout” tab on the Excel ribbon.2) Find the “Sheet Options” group on that tab.3) Check the “Headings View” box to display Column letters.4) Widen any report columns that require it (double-click the dividing line between theproblematic column header and the header to its right to automatically widen thecolumn so it displays the widest entry in that column).5) Turn back off column headers.The “Variance” column widened to display all values.The Regression and Forecasting Command Group on the RibbonThis command group on the <strong>FSBstats</strong> tab contains two buttons: “Regression” and“Forecasting”. Before you use either option, be sure to name the data ranges you’ll beusing in your analysis (use the “Name Your Data” group and its “Create from Selection”button described above or any other Excel range naming technique). Both the“Regression” and the “Forecasting” option indicate data by means of range names.The “Regression” ButtonClick the “Regression” button to open the “Please Choose the Dependent andIndependent Variables” dialog.Choose Regression VariablesIn this dialog a model name and the Confidence Level are preset for you. To changeeither one, click in its text box and replace the default with your own choice. Model10