The SMART Group SMART ANNUAL REPORT 2001 - Scandinavia
The SMART Group SMART ANNUAL REPORT 2001 - Scandinavia
The SMART Group SMART ANNUAL REPORT 2001 - Scandinavia
- No tags were found...

You also want an ePaper? Increase the reach of your titles
YUMPU automatically turns print PDFs into web optimized ePapers that Google loves.
<strong>The</strong> <strong>SMART</strong> <strong>Group</strong><strong>Scandinavia</strong>n Multi Access Systems <strong>SMART</strong> ABand <strong>SMART</strong> Sverige ABGävlegatan 22, Box 6602,SE-113 84 Stockholm, SwedenPhone: +46 8 458 05 00Fax: +46 8 32 01 90e-mail: smart@smart.sewww.smart.se<strong>SMART</strong> Danmark A/SBanestrøget 13DK-2630 Taastrup, DenmarkPhone: +45 43 32 75 00Fax: +45 43 71 75 57e-mail: infodk@smart.dkwww.smart.dk<strong>SMART</strong> Norge ASMagnus Poulssons vei 7NO-1366 Lysaker, NorwayPhone: +47 67 10 70 00Fax: +47 67 10 70 01e-mail: smart@smart.nowww.smart.no<strong>SMART</strong> Amadeus SIAValnu Str. 18LV-1050, Riga, LatviaPhone: +371 721 68 30Fax: +371 721 68 33e-mail: smart@amadeus.lv<strong>SMART</strong> Amadeus UABA. Jouzapaviciaus 6⁄2LT-2005 Vilnius, LithuaniaPhone: +370 272 68 69Fax: +370 272 68 70e-mail: smart@amadeus.lt<strong>SMART</strong> <strong>ANNUAL</strong> <strong>REPORT</strong> <strong>2001</strong>
<strong>SMART</strong>’S DIFFERENT FACES<strong>SMART</strong> began in 1984 to meet the needs oftravel producers to streamline their distributionto travel agencies. At the same time,the market was demanding simplified andstandardised reservation systems.Today <strong>SMART</strong> offers an infrastructure forthe electronic distribution of travel information,reservations, tickets, and paymentsbetween travel producers, travel agencies,and end customers.<strong>The</strong> travel agencies are mostimportant<strong>SMART</strong>’s most important customer group istravel agencies – both traditional and webbased.It is together with the agencies that weare able to supply value to the travel producersthrough an effective sales infrastructure.From the very beginning we quicklybecame the leading distributor of electronictravel services to travel agencies, and wequickly became an important part of thetravel industry’s total infrastructure.<strong>SMART</strong> now has operations in Denmark,Norway, Sweden, Latvia and Lithuania. Bythe end of <strong>2001</strong> over 1,800 travel agencieswere associated with us through nearly12,000 workstations. Among travel agencieswe have a market share of approximately 80per cent. Approximately 70 per cent of allflight reservations in <strong>Scandinavia</strong> are nowmade through our system. Each year we handlereservations (airline, rail, hotel, charter,etc.) for a value of more than SEK 60 billion.Since the mid-1990s <strong>SMART</strong> has been thegeneral agent for Amadeus, the world’s largestGDS (Global Distribution System). Amadeushas representatives in 200 countries through70 national marketing companies, of which<strong>SMART</strong> is one.Today 460 airlines, 58,000 hotels, andapproximately 50 car rental agencies are availablethrough Amadeus.<strong>The</strong> Internet has changed thetravel worldDistribution and sales of travel services havefundamentally changed with the advent of theInternet. It is no longer just the professionaltravel agents that can reserve their tickets electronically.Numerous travel sites offer basicways of making reservations. <strong>The</strong> Internet hasalso allowed producers to complement theirtraditional direct sales via phone and in theirshops with various e-business solutions. <strong>The</strong>sesales channels increasingly bypass <strong>SMART</strong> andtravel agencies.To meet the needs of the end customer,we have built up extensive expertise in recentyears with travel management systems aimeddirectly at companies and consumers. Untilrecently, we sold our services through travelagencies and directly to end customers. Inthe future, though, we will only sell throughtravel agencies.Our business concept and visionSmart’s business concept is to make the distributionof travel more effective by being better thananyone else at studying, predicting, and meetingthe needs of travel agencies for systems that integratethe travel market with a producer-neutralmarket place.Our vision is to be the best at meeting theneeds of travel agencies for systems that link thetravel market with a neutral market place.SAS 95% Amadeus 5%<strong>Scandinavia</strong>n Multi Access Systems <strong>SMART</strong> AB<strong>SMART</strong>’s organisation<strong>The</strong> <strong>SMART</strong> <strong>Group</strong> consists of a parent company, <strong>Scandinavia</strong>n MultiAccess Systems <strong>SMART</strong> AB, and five subsidiaries: <strong>SMART</strong> Danmark A/S(Denmark), <strong>SMART</strong> Norge AS (Norway), <strong>SMART</strong> Sverige AB (Sweden),<strong>SMART</strong> Amadeus SIA (Latvia), and <strong>SMART</strong> Amadeus UAB (Lithuania).<strong>The</strong> <strong>Group</strong>'s owners are presented in the organisation chart on thenext page.<strong>SMART</strong>Sverige AB78.25% <strong>SMART</strong>21.75% SJ<strong>SMART</strong>Norge AS70% <strong>SMART</strong>30% Braathens AS<strong>SMART</strong>Danmark A/S100% <strong>SMART</strong> 95% <strong>SMART</strong>5% Amadeus6 7<strong>SMART</strong>Amadeus SIA(Latvia)<strong>SMART</strong>Amadeus UAB(Lithuania)95% <strong>SMART</strong>5% AmadeusBokserTravel AB100 % <strong>SMART</strong>
A DRAMATIC YEARDuring <strong>2001</strong> a number of events impacted thetravel industry in both negative and positiveways. A downturn in the economy was alreadyevident at the beginning of the year, and thiswas reflected in the reservation statistics. <strong>The</strong>nthe terrorist attacks occurred in September.In just a few weeks in September, reservationvolumes fell dramatically, primarily for airlines.<strong>The</strong> levels had stabilised by the end of theyear, though at a lower level. Year over year thetotal air traffic market in <strong>Scandinavia</strong> fell by10 per cent on average.Industry trendsIn addition to the changes resulting fromevents and economic cycles, the industrytrends of recent years have been strengthened.Many travel producers continue to developtheir own channels for direct sales that bypass<strong>SMART</strong> and travel agencies. Though there isgreat interest in e-business, it should be notedthat travel producers have primarily increasedtheir direct sales from phone orders and shopsales and not, as assumed, through sales overthe Internet. We can see signs however thatinterest of travel producers for the new distributionchannels is waning. It is again becominginteresting to examine more closely thetype of neutral joint distribution that <strong>SMART</strong>and travel agencies represent. <strong>The</strong> old adagestill holds true – the more that share the costof distribution, the cheaper it is. And themore travel producers and travel agencies usethe same sales channel, the simpler it is forend customers to make their travel purchase.For customers, there will always be substantialvalue in purchasing trips through aneutral and impartial supplier – someonewho lets customers compare different producersand purchase all the trips at a single place.Travel agencies in focusTo improve <strong>SMART</strong>’s product selection evenmore, we have conducted an extensive analysisof our company, our products, and thetrends of the last year. This analysis has inturn led to a revision of our business planand strategies. This has resulted in the companyworking even closer with travel agenciesand local producers that travel agencies considerstrategically important.Success depends on our ability to offertravel agencies products that improve theirefficiency and strengthen their relations withend customers. We also have to be better atdeveloping services customised for specifictravel agency segments – business travel agencies,consumer travel agencies, variations ofthe two, and tour operators. If they are doingwell, <strong>SMART</strong> is doing well. <strong>The</strong>re is an interactionbetween <strong>SMART</strong> and the agencieswhere success breeds success.New times, new organisationSince we began revising our business plan inthe spring, we were able to react quicklywhen the market collapsed in connectionwith the terrorist attacks in the US onSeptember 11 and were able to put a planinto action on very short notice. This plannot only responded to the acute events in theUnited States, but also allowed <strong>SMART</strong> toaddress the more long-term need of adaptingthe company to the structural changes thatthe travel industry is undergoing. Steps takenhave included adjusting <strong>SMART</strong>’s organisationand the reallocation of company resources.Two new functionsIn order to improve relations with Amadeusfurther, we have created a new staff – AmadeusRelations & Market Communication.We have also concentrated all expertisewithin user support and training to the newCustomer Services Division. This will allowus to focus all our efforts on providing thebest possible service to travel agencies.Our staff that previously focused on salesof travel management systems directly tocompanies have now been transferred to the8 9
Travel Agency Division. Focus and resourcesare now aimed at helping travel agencies withpackaging and distributing products that arebooked by the end customers themselves.This in turn is the result of our convictionthat the market will always demand a neutraland full service supplier – someone who canprovide independent buying advice and guidancewhen purchasing trips. <strong>SMART</strong> and ourpartner travel agencies offer the most choiceand the most extensive product selectionavailable to customers.In addition to the company reorganisation,during <strong>2001</strong> we have also continued to sellsubsidiaries and operations that do not directlysupport our core business. At the beginningof the year we sold FM Partner AB, awholly owned subsidiary that focuses onFacility Management.Global needsAmong large business travel purchasers, thereis still great interest in signing global contractswith travel agencies and travel producers.International companies require multinationalservice. It is this demand from themarket that we together with the travelagencies and travel producers must address.Together with our most important partner,Amadeus, we are able to meet these needs.Through Amadeus’ global presence and<strong>SMART</strong>’s strong local representation, we havedefended our position on the travel agencymarket as the leading distributor of electronictravel services.Telenor — a new partner<strong>SMART</strong> signed an agreement with theNorwegian telecom provider Telenor in <strong>2001</strong>.As a result, we will be implementing a newIP-VPN network (Virtual Private Network).<strong>The</strong> goal is to create the conditions neededfor future broadband applications, and thuslay the groundwork for a modern platformthat will ultimately strengthen the positionof travel agencies on the market.Amadeus Corporate Travellersuccessful on the travel agentmarketBusiness travellers make up 70 per cent ofairline reservations and are also the customergroup that has increased their use of Internetbasedreservations the fastest. That is why it isimportant for us to provide travel agencieswith effective customer self-service reservationproducts that simplify their own workand satisfy customer needs.Amadeus Corporate Traveller is just thiskind of tool. It not only makes the reservationwork more efficient, it also saves moneyfor end customers by allowing them to controltheir travel purchases based on travelguidelines and special contracts they havenegotiated with travel producers.All major travel agency chains have signedwith <strong>SMART</strong> to begin using Amadeus CorporateTraveller for their electronic travel sales.Thus, the conditions are also in place for theend customers, business travel purchasers, tojoin the system. During the year we have seenthat both the number of installations and thenumber of reservations have increased.<strong>The</strong> launch of <strong>SMART</strong> ZoneWe launched <strong>SMART</strong> Zone in <strong>2001</strong>, acompletely new web-based portal for ourcomplete range of travel agency services.Eventually, the platform will make it possiblefor travel agents to customise their toolsbased on their needs.<strong>The</strong> goal has been to create a virtual workplace that is based on the latest technologiesand makes use of the advancements <strong>SMART</strong>has made in user friendliness and ergonomicinterface.<strong>The</strong> paperless journeyTravelling without physical tickets is becomingincreasingly common. <strong>SMART</strong>’s solutionwith e-tickets and electronic travel itinerariesvia SMS, known as <strong>SMART</strong> Itinerary, hasgained increasing acceptance during <strong>2001</strong>.In addition to travellers not having to dealwith tickets and itineraries, travel agencies areable to streamline their work by simplifyingroutines.New cruise productsAll <strong>SMART</strong> partner travel agencies have hadonline access to many of the world’s leadingcruise operators since the autumn <strong>2001</strong>.Travel agents can book trips via the InternetbasedAmadeus Cruise on Royal CaribbeanCruise Line, Celebrity Cruises, and PrincessCruise Lines. Several other operators will bejoining soon. So far, reservations can be madethrough Amadeus in the US, Canada and<strong>Scandinavia</strong>.<strong>The</strong> best price with Value PricerOne of last year’s most popular products wasAmadeus Value Pricer. This new serviceallows travel agencies to easily find andreserve the least expensive air flights based onthe customer’s wishes. Value Pricer is anexcellent example of how <strong>SMART</strong> andAmadeus offer travel agencies tools that bothsimplify the work of agents and create realbenefits.STINA sells train ticketsWhen SJ (formerly part of the Swedish StateRailways) needed to develop a new salessystem for their products, they turned to<strong>SMART</strong>. <strong>The</strong> result was STINA – an electronicsales platform for travel agencies. <strong>SMART</strong>’scustomers began reaping the rewards of thispartnership in the latter half of the year whenthe system was installed at travel agencies.Change in sightAfter a turbulent time, we now view thefuture with optimism. In spite of the declinein reservation volumes, a clear stabilisationoccurred at the end of the year. <strong>The</strong> downwardspiral has slowed and even if the curvesaren’t pointing up yet, the level of new reservationsis steady. In addition, travel agenciesare clearly signalling us that they appreciateour increasing focus on supporting theirwork. This is most evident in agencies’increased interest in <strong>SMART</strong>’s self-servicereservation products.Amadeus takes a moreprominent role<strong>SMART</strong>’s strong local representation togetherwith Amadeus’ global presence has been asuccessful combination over the years. We willcontinue to expand our partnership withAmadeus and develop our product portfolio,which is likely already one of the strongest onthe market. One of the most important tasksahead is to help travel agencies develop toolsthat handle their unique products, such asspecial contracts, prices, purchased flight seats,etc. We can also see that Amadeus is increasinglyadding new distribution solutions thatcomplement or overlap <strong>SMART</strong>’s existingproduct range.This means that in the future we canreduce our own internal development andinstead use the products developed byAmadeus. Some examples of these areAmadeus Travel Assistance (purchasing travelinsurance), Amadeus Cruise, Amadeus Ferry(cruise reservations), Amadeus Tours (purchasingtravel packages), and the train ticketreservation service Amadeus Rail.10 11
GROUP ACCOUNTS FOR FINANCIAL YEAR <strong>2001</strong><strong>The</strong> Board of Directors and the Chief Executive Officer of <strong>Scandinavia</strong>nMulti Access Systems <strong>SMART</strong> AB hereby submit the Annual Report andConsolidated Accounts for financial year <strong>2001</strong>.DIRECTORS’ <strong>REPORT</strong>Ownership<strong>Scandinavia</strong>n Multi Access Systems <strong>SMART</strong> ABis a subsidiary of <strong>Scandinavia</strong>n AirlinesSystems (SAS). <strong>SMART</strong> AB is 95 per cent ownedby SAS and 5 per cent owned by AmadeusGlobal Travel Distribution S.A. SAS AB is listedon Stockholmsbörsen.General<strong>SMART</strong>’s business concept is to provide activeplayers on the travel market an electronicinfrastructure that links airlines, hotels,car rental agencies, cruise operators, andcharter operators with travel agencies and endcustomers – businesses and travellers.During <strong>2001</strong>, <strong>SMART</strong> has continued itsefforts that began in 2000 to streamline itsoperations. This has involved selling non-corebusinesses. For this reason, at the beginningof the year the company sold FM Partner AB,a wholly owned subsidiary working withFacility Management.We have also focused resources on coreoperations, that is to say caring for customerrelations with travel agencies and travel producersof importance for travel agencies.<strong>SMART</strong> has adjusted its organisation to thelower reservation volumes that became evidentin the first quarter <strong>2001</strong>. <strong>The</strong> downturn was adirect result of the growing recession and wassubstantially accentuated by the terroristattacks in New York on September 11, <strong>2001</strong>.Steps were initiated to address the combinationof falling reservation volumes and revenue.This included reductions in staff thatgave cost savings comparable to the decreasein revenue. Costs for staff reductions, whichare reported as items affecting comparability,have primarily affected financial year <strong>2001</strong>.<strong>The</strong> travel agency market<strong>The</strong> current trend toward direct sales has stagnatedin Denmark and Norway during theyear in spite of major investments by producers.This has resulted in <strong>SMART</strong> and travelagencies on these markets having marginallyimproved their market share. In Sweden onthe other hand, direct sales have increasedsomewhat during the year to the detriment ofsales via travel agencies.<strong>SMART</strong> continues to be the dominant forcefor reservation systems for travel agencies in<strong>Scandinavia</strong>, Latvia and Lithuania with amarket share of approximately 80 per cent.Amadeus is via <strong>SMART</strong> the dominant companyin <strong>Scandinavia</strong> and the largest in Europe interms of providing reservation systems fortravel agencies.<strong>The</strong> producer marketVolumes decreased for all producers associatedwith <strong>SMART</strong>, primarily because of the recession.Direct sales have in some areas taken sharefrom trips arranged through agencies, butthere are also examples of companies changingdistribution strategy and choosing to go tomarket with their entire product range beingoffered through travel agencies.1213
SJ and <strong>SMART</strong> signed a new contract duringthe year for travel agency distribution. <strong>The</strong>contract contains a partnership section thatdefines the areas for joint development.STINA, the reservation system developedtogether with SJ, began to be installed duringthe second half of the year.Products<strong>SMART</strong> provides the travel industry an effectivemarketplace for the purchase and sale of tripsby offering access to the Amadeus reservationsystem. <strong>SMART</strong>’s product portfolio includesreservations for trips, printing tickets, support,and helpdesk services. <strong>SMART</strong> also offers aportfolio of additional products that complementthe core product range. <strong>SMART</strong>’s goal is tocontinually adapt our product range to ourdifferent customer segments, such as businesstravel agencies, consumer travel agencies,travel agencies with mixed target groups, andtour operators.Product development<strong>SMART</strong> offers local producers, such as airlines,passenger train operators, charter operators,cruise operators, and hotels, customer specificdistribution and administration systems.<strong>SMART</strong> has developed systems over several yearswith customer specific solutions. During thelast few years Amadeus has begun to producecentral distribution solutions for passengertrain and cruise operators. This lets <strong>SMART</strong>reduce the extent of its own internal distributionsystems since Amadeus now meets mostof the needs on the market.An example of this is Amadeus’ introductionof a large number of new systems formaking trip reservations for a broad spectrumof travel producers. Two of the new productsare Amadeus Travel Assistance and AmadeusCruise. All the systems have been introducedon the <strong>Scandinavia</strong>n market.<strong>The</strong> STINA client is a graphic and very userfriendlyreservation interface for train travelwhich was developed in collaboration betweenSJ and <strong>SMART</strong>. By the end of <strong>2001</strong>, STINA hadbeen installed at 200 Swedish travel agencies.STINA has been positively received and installationat our remaining customers should becompleted by mid-2002.OrganisationOver the last year <strong>SMART</strong> has evaluated andadjusted its organisation. <strong>The</strong> goal with thenew organisation has been to open up the wayto a more effective production and serviceorganisation by better understanding theneeds of our customers. <strong>The</strong> new organisationwas implemented at the beginning of 2002and consists of five divisions, including onenew division called the Customer ServicesDivision. <strong>The</strong> Customer Services Division isintended to support the helpdesk, training,and sales support and thus make our productrange more attractive to customers and focuson their needs.Another important change is that thedivision previously responsible for sales ofcustomer self-service reservation products forcompanies has been incorporated into theTravel Agency Division. This change meansthat all sales of reservation system tools, suchas travel agency systems and customer selfservicereservation systems, are now gatheredunder the Travel Agency Division.<strong>The</strong> new organisation has five staffs, includinga new one, Amadeus Relations &Market Communication. Amadeus Relationsis responsible for improving collaborationwith Amadeus.CommunicationsIn June <strong>2001</strong> <strong>SMART</strong> and Telenor began apartnership where Telenor will deliver communicationsolutions via <strong>SMART</strong> to all of<strong>SMART</strong>’s travel agency customers in <strong>Scandinavia</strong>.This new communication network shouldbe able to meet the needs of tomorrow’s applications.By upgrading technologies, <strong>SMART</strong>is able to develop better services for travelagencies.Older technologies will be replaced by new,more modern graphical interfaces. This givesusers better support in their work and helpslead to larger increases in efficiency. <strong>The</strong> sametechnology has been used in the developmentof <strong>SMART</strong> Zone and the STINA client for reservationsof train tickets.Financial performance<strong>The</strong> <strong>Group</strong>’s net turnover was SEK 531.3 million,which is a decrease of nine per centcompared to the previous year. This decreasein turnover is the result of the sale of the subsidiaryTRISS AB and the business unit TradeVision during 2000. <strong>The</strong> decrease in netearnings was also the result of the sale of FMPartner AB during financial year <strong>2001</strong> and thedecrease in reservation volumes during <strong>2001</strong>compared with the previous year.<strong>The</strong> <strong>Group</strong>’s profits were SEK 59.3 million(32.0), an increase of SEK 27.3 million comparedwith the previous year. <strong>The</strong> improvementin profits is primarily the result of thesale of several subsidiaries with low profitabilityduring 2000 and at the beginningof <strong>2001</strong>. Profits increased in comparable corporateunits in spite of decreases in revenuefrom lower reservation volumes primarilyas a result of strict cost-cutting measures.A settlement was reached with suppliers ofthe IT system developed for the subsidiaryBokser Travel AB. <strong>SMART</strong> has acquired 49%of the stock capital of Bokser Travel AB. Thus,Bokser Travel AB is now a wholly owned subsidiaryof the parent company in the <strong>SMART</strong><strong>Group</strong>. <strong>The</strong> sale of FM Partner AB resulted in acapital gain of SEK 6.2 million, which isreported under items affecting comparability.Additionally, WTM (Wireless Travel Management),a system for making travel reservationsand accessing information via mobile phones,was sold with a capital gain of SEK 2.3 million,which is also reported under items affectedcomparability.R&D<strong>The</strong> cost of the <strong>Group</strong>’s product developmentfor the year was SEK 40 million.Future trends<strong>The</strong> weak trend during the second half of<strong>2001</strong> resulted from the combination of arecession and the aftermath of the terroristattacks in New York on September 11. <strong>The</strong>current low reservation level is expected tocontinue during the first half of 2002 with aslight improvement occurring in the secondhalf of 2002. <strong>SMART</strong>’s earnings are expected tobe half of <strong>2001</strong>’s earnings as a direct result ofthe current recession.Proposal for distribution of earnings<strong>Group</strong>According to the consolidated balance sheet,non-restricted equity is SEK 80,808 thousand.No allocation to restricted reserves is proposed.Parent Company<strong>The</strong> following assets are at the disposal of theAnnual General Meeting (SEK thousands):Retained earnings 2,637Net profit for the year 32,66835,305<strong>The</strong> Board and the CEO propose that the followingamount be brought forward 35,30535,305For more information on the company’searnings and position in general, refer to thefollowing earnings statements and balancesheets, statement of changes in financialposition, and supplementary information.All amounts are in SEK thousands unlessotherwise indicated.14 15
Income statementsBalance sheets<strong>Group</strong>Parent CompanySEK thousands Note <strong>2001</strong> 2000 <strong>2001</strong> 2000<strong>Group</strong>Parent CompanySEK thousands Note 31-12-<strong>2001</strong> 31-12-2000 31-12-<strong>2001</strong> 31-12-2000ASSETSOperating income, etc.Net sales 1, 2 531,299 582,029 553,457 531,043Capitalised assets 0 8,443 – –Other operating income 3 18,500 0 – –Total income, etc 549,799 590,472 553,457 531,043Operating expensesMiscellaneous external expenses 4, 5 –316,120 –404,244 –384,237 –401,876Personnel expenses 6 –160,222 –173,674 –119,724 –104,268Depreciation of intangible andtangible fixed assets 13, 14 –9,013 –15,219 –7,595 –9,261Items affecting comparability 7 –4,575 27,696 –3,149 38,336Write-down of shares in subsidiary – – 0 –12,600Operating profit 59,869 25,031 38,752 41,374Result from financial investmentsMiscellaneous interest income andsimilar items 8 26,883 14,690 21,629 12,874Interest expense andsimilar items 9 –705 –6,960 –1,318 –9,637Profit after financial items 86,047 32,761 59,063 44,611Appropriations 10 – – –12,685 –10,891Tax on profit for the year –16,983 –16,811 –12,997 –12,401Deferred tax 11 4,254 –4 973 –713 –723Minority shareholding –13,995 20,999 – –PROFIT FOR THE YEAR 59,323 31,976 32,668 21,596Fixed assetsIntangible fixed assetsCapitalised expenditure for researchand development 12 0 0 – –Goodwill 13 0 4,165 – –0 4,165 – –Tangible fixed assetsEquipment, computers and peripherals 14 8,843 15,065 6,121 9,6918,843 15,065 6,121 9,691Financial fixed assetsParticipations in <strong>Group</strong> companies 15 – – 25,858 25,724Other shares and security holdings 16 30,062 30,082 30,000 30,000Other long-term receivables 4,417 7,365 3,000 3,787Delayed tax debts 11 545 358 1,924 2,63735,024 37,805 60,782 62,148Total fixed assets 48,867 57,035 66,903 71,839Current assetsCurrent receivablesAccounts receivable 80,724 78,919 46,787 49,831Receivables from <strong>Group</strong> companies – – 1,970 20,216Receivables from Parent Company 17 108,444 154,362 87,066 119,979Other receivables 24,641 45,665 11,508 25,420Prepaid expenses andaccrued income 18 71,291 96,419 31,713 44,627285,100 375,365 179,044 260,073Cash and bank balances 107,877 56,612 40,972 13,792Total current receivables 392,977 431,977 220,016 273,865TOTAL ASSETS 436,844 489,012 286,919 345,70416 17
Statement of changes in financial position<strong>Group</strong>Parent CompanySEK thousands Note 31-12-<strong>2001</strong> 31-12-2000 31-12-<strong>2001</strong> 31-12-2000<strong>Group</strong>Parent CompanySEK thousands <strong>2001</strong> 2000 <strong>2001</strong> 2000EQUITY AND LIABILITIESEquity 19Restricted equityShare capital, 200,000 sharesat nominal value SEK100 20,000 20,000 20,000 20,000Restricted reserves 54,669 42,334 4,000 4,000Total restricted equity 74,669 62,334 24,000 24,000Non-restricted equityProfit brought forward – – 2,637 45,731Non-restricted reserves 21,585 61,577 – –Profit for the year 59,323 31,976 32,668 20,596Total non-restricted equity 80,908 93,553 35,305 66,327Total equity 155,577 155,887 59,305 90,327Untaxed reserves 21 – – 45,579 32,894Minority share of equity 20 21,246 –3,082 – –ProvisionsDeferred tax liability 11 3,422 8,489 – –Other provisions 6,214 – – –9,636 8,489 – –Current liabilitiesAdvance payments from customers 0 95 – –Accounts payable 15,544 61,306 4,681 23,108Liabilities to <strong>Group</strong> companies 1,449 21,648 126,777 130,566Income tax liability 5,895 6,468 4,025 4,027Other current liabilities 37,737 27,723 4,453 3,364Accrued expenses andprepaid income 22 189,760 210,478 42,099 61,418Total current liabilities 250,385 327,718 182,035 222,483TOTAL EQUITY AND LIABILITIES 436,844 489,012 286,919 345,704Sources of fundsProfit after financial items 86,047 32,761 59,063 44,611Adjustments for items not affectingliquidity, etc. 30,883 21,865 14,318 13,530116,930 54,626 73,381 58,141Income tax paid –18,577 –9,990 –12,999 –8,374Cash flow from operationsbefore changes in working capital 98,353 44,636 60,382 49,767Cash flow from changes in working capitalDecrease/increase in accounts –1,805 14,362 3,044 –2,153receivableDecrease/increase in receivables 92,398* –136,887 78,571** –65,834Decrease/increase in accounts –45,763 –2,051 –18,427 –2,368payableDecrease/increase in current liabilities –99,909 97,373 –95 992 94,615Cash flow from current operations 43,274 17 433 27,578 74,027Investment activitiesAcquisition of shares in <strong>Group</strong> companies – – –1,980 –300Acquisition of tangible fixed assets –4,009 –16,495 –2,132 –5,675Payment related to settlement 12,000 0 – –Acquisition of financial assets 0 –5,219 0 –6,000Sale of tangible fixed assets 0 1,363 0 1,295Sale of subsidiary – – 5,200 –Cash flow from investment activities 7,991 –20,351 1,088 –10,680Financing activitiesAmortisation of liabilities 0 –73,422 0 –65,000Shareholders’ contribution – – –1,486 –14,993Cash flow from financing activities 0 –73,422 –1,486 –79,993Cash flow for the year 51,265 –76,340 27,180 –16,646Liquid assets at beginning of year 56,612 132,952 13,792 30,438Liquid assets at end of year 107,877 56,612 40,972 13,792MEMORANDUM ITEMS<strong>Group</strong>Parent CompanyNote 31-12-<strong>2001</strong> 31-12-2000 31-12-<strong>2001</strong> 31-12-2000Pledged assets 23 none none none noneContingent liabilities 24 852 772 852 772* Changes in the balance of the <strong>Group</strong> account by –57,786 for <strong>2001</strong> and –48,254 for 2000 are included inDecrease/increase in receivables.** Changes in the balance of the <strong>Group</strong> account by –36,709 for <strong>2001</strong> and –47,681 for 2000 are included inDecrease/increase in receivables.18 19
Supplementary information, notesGeneral accounting principlesthe parent company, attributable to acquisitions<strong>The</strong> accounting principles applied correspond with stocks in subsidiaries, are balanced group wide asthe Annual Accounts Act and general advice, recommendationsand policy from the Swedish Accounting differences.the subsidiaries’ equity and booked as translationStandards Board and recommendations and policyLeasingfrom the Swedish Financial Accounting StandardsAll leasing agreements have been classified as operationalleasing agreements and are booked in theCouncil and FAR.<strong>SMART</strong> has implemented for the financial yearincome statement as operating expenses.<strong>2001</strong> the following new recommendations from theSwedish Financial Accounting Standards Council; <strong>Group</strong> contributionRR 9, Income taxes, RR 11, Revenue and RR 12,Accounting of group contributions follows theTangible assets. <strong>The</strong> application of RR 9, IncomeSwedish Financial Accounting Standards Counciltaxes has resulted in the change of accounting principles.Comparison figures for 2000 have thereforepolicy on accounting of group contributions. <strong>Group</strong>contributions received to minimise the <strong>Group</strong>’s taxesbeen adjusted. <strong>The</strong> application of other new recommendationshas not had any significant affect onare booked as an increase in non-restricted equityafter deduction for the actual tax.<strong>SMART</strong>’s reporting.TaxConsolidated accountsTax for the period is based on the results from the<strong>The</strong> <strong>Group</strong>’s earnings statements and balance sheetperiod being adjusted for non-tax deductible costsincludes all companies in which the parent companyand non-taxable income. <strong>The</strong> tax is calculated fromhas a direct or indirect majority share of the stocksthe accounting date as indicated by the rate of tax.voting value and companies in which the <strong>Group</strong> inWhen accounting deferred tax, the balance sheetany other way has a significant influence and a significantshare of the profits of their operations. <strong>The</strong> con-method is used in which temporary differences, thatis difference between assets or debts accounted andsolidated accounts have been prepared in accordancetaxable value, results in deferred tax receivables orwith the recommendations of the Swedish Financialtax liabilities.Accounting Standards Council on consolidatedDeferred tax liabilities are normally accounted foraccounts, RR 1:96. All acquisitions of companies areall taxable temporary differences while deferred taxbooked according to acquisition accounting.receivables are accounted to the extent that it is likelyAcquisition accounting means that assets and debtsthat taxable surpluses will be created for which theare booked at market values according to establisheddeductible temporary differences can be used.acquisition analyses. If the acquisition value exceedsDeferred tax receivables are accounted for the deficitthe current market value of the company’s net assets,deductions and temporary differences betweenthe difference is booked as <strong>Group</strong> goodwill.accounted and taxable results to the extent they areConversion of foreign subsidiaries’ earnings judged to will be used within a five-year period.statements and balance sheetsDeferred tax liabilities are accounted for all taxabletemporary differences attributable to invest-<strong>The</strong> current method is used when foreign subsidiaries’earnings statements and balance sheets are ments in subsidiaries except in those cases where theconverted to Swedish kronor. All assets and debts in <strong>Group</strong> can determine the time for restoration of thethe subsidiaries’ balance sheets are thereby converted temporary differences and it is likely that such ato the accounting date’s rate and all items in income restoration will take place in the near future.statements to the year’s average rate. Any translation Deferred tax is calculated based on the tax ratesgains/losses are booked directly to equity. Exchange that are expected to apply in the period that the tax israte differences for loans in foreign currencies in levied. Deferred tax is accounted for over the incomestatement except in those cases that the underlyingtransaction is accounted directly to equity in whichcase the deferred tax is also accounted directly toequity.Deferred tax receivables and deferred tax liabilitiesare net accounted if the items are intended for thesame tax jurisdiction.<strong>The</strong> <strong>Group</strong>’s taxes consist of taxes on the <strong>Group</strong>companies’ booked profits and tax adjustments forprevious periods and changes to deferred tax liabilities.Any tax credits resulting from dividends fromsubsidiaries reduce direct taxes.Untaxed reserves booked in the individual <strong>Group</strong>companies are divided in the consolidated balancesheet into a capital part and a tax part. <strong>The</strong> capitalpart has been transferred to restricted reserves. <strong>The</strong>tax part is normally booked as appropriations underthe heading deferred tax liabilities.Fixed assetsAccounting of tangible assets follows RR 12. <strong>The</strong>tangible assets are booked to acquisition costs withdeductions for planned write offs based on a judgementof the assets’ economic life span.Depreciations according to schedule are madeaccording to the following:Inventories, computers and computerequipment 20‒50%<strong>The</strong> difference between depreciations according toschedule and booked write offs are booked as balancesheet appropriations.ReceivablesReceivables are booked to the amount they areexpected to be received.Receivables and debts in foreign currenciesReceivables and debts in foreign currencies are valuedto the rate on the accounting date or to the forwardrate. Exchange rate differences attributable to operativeitems are net accounted as other operatingrevenues or other external costs. Exchange rate differencesattributable to financial income and expenseare net accounted under Profit/loss from financialinvestments.AllocationsAllocations are accounted for when the <strong>Group</strong> has anexisting commitment, whether of legal or of informalcharacter, from previous events and if it is likely thata payment of financial funds will be necessary tomeet these obligations and if it is possible to make areliable estimation of the amount to be paid.Research and developmentExpenses for research and development are normallylisted as they occur.Revenue recognition<strong>SMART</strong>’s turnover is determined based on therecommendations of the Swedish Financial AccountingStandards Council RR 11, Incomes, which meansthat all sales are accounted for with deductions forgiven discounts.Net turnover includes licensing fees, reimbursementsfor reservations, and sales of products. Revenuerecognition occurs when products or servicesare used by the customer.<strong>SMART</strong> AB has entered into commission agreementswith the subsidiaries <strong>SMART</strong> Sverige AB andSmart Danmark A/S. <strong>The</strong> commission agreementsmean that the subsidiaries in Denmark and Swedenreceive a commission for supplying and distributingthe parent company’s products on the Swedish andDanish markets.<strong>The</strong> subsidiaries’ net income after deductionsfor the received discounts is transferred to the parentcompany. In the same way, the subsidiaries arereimbursed for costs.<strong>The</strong> parent company’s income statement includesitems according to the commission agreementaccording to the following:Parent company prior to smart smart Parent company aftercommission agreement Sverige ab Danmark a/s commission agreementNet turnover 454,823 96,377 2,257 553,457Other external costs ‒287,370 ‒76,491 ‒20,375 ‒384,236Personnel expenses ‒65,954 ‒27,320 ‒26,450 ‒119,724Write offs ‒6,025 ‒675 ‒895 ‒7,595Items affecting comparability 1,877 ‒2,626 ‒2,400 ‒3,14920 21
Note 1 Net sales by geographical market (SEK thousands)Net sales were distributed across geographical <strong>Group</strong> Parent Companymarkets as follows: <strong>2001</strong> 2000 <strong>2001</strong> 2000Sweden 512,676 540,019 551,200* 518,323Norway 138 27,087 0 1,674Denmark 15,859 10,750 2,257** 10,853Great Britain 0 194 0 193Baltic States 2,626 3,979 0 0Total 531,299 582,029 553,457 531,043*SEK 96,377 thousand (preceding year 83,990) is attributed to <strong>SMART</strong> Sverige AB in accordance with the commissionagreement.**SEK 2,257 thousand (preceding year 3,689) is attributed to <strong>SMART</strong> Danmark A/S in accordance with the commissionagreement.Note 2 Purchases and sales within the <strong>Group</strong>, etc.Purchases and sales between <strong>Group</strong> Parent Company<strong>Group</strong> companies <strong>2001</strong> 2000 <strong>2001</strong> 2000Purchases 24.6% 21.4% 62.2% 58.9%Sales 0.1% 1.0% 19.9% 17.6%Note 3 Other operating incomeTransfer of rights in conjunction with resolution of dispute with supplier.Note 4 Other external costsOther external costs for <strong>SMART</strong> Sverige AB SEK 76,491 thousand (preceding year 56,837) and<strong>SMART</strong> Danmark A/s SEK 20,375 thousand (preceding year 17,120) included in the parent company’sother external expenses in accordance with the commission agreement.Note 5 Auditor’s fee and compensation for expenses (SEK thousands)Deloitte & Touche AB <strong>Group</strong> Parent Company<strong>2001</strong> 2000 <strong>2001</strong> 2000Audit 1,229 793 733 204Other assignments 3,346 1,968 3,146 1,628Total 4,575 2,761 3,878 1,832Note 6 Average number of employees, salaries, other remunerationand social welfare contributionsAverage number of employees <strong>2001</strong> 2000Number of Pct. of men Number of Pct. of menemployeesemployeesParent CompanySweden 84 58 78 60Denmark 0 0 2 50Great Britain 0 0 1 100Total, Parent Company 84 58 81 60SubsidiariesSweden 49 42 104 50Norway 66 38 61 65Denmark 46 47 46 47Latvia 2 50 3 60Lithuania 2 25 3 20Total, subsidiaries 165 41 217 52Total, <strong>Group</strong> 249 47 298 54Salaries, remuneration, etc. (SEK thousands) <strong>2001</strong> 2000Salaries and Soc. welf. Salaries and Soc. welf.other rem. (of which other rem. (of whichpens. costs)pens. costs)Parent Company 76,993 30,229 72,725 27,757(9,688) (8,004)Subsidiaries 34,207 5,580 42,626 12,345(469) (2,307)<strong>Group</strong> 111,200 35,809 115,351 40,102(10,157) (10,311)Distribution of salaries and other remuneration by countryand between Board members, etc., and employees (SEK thousands) <strong>2001</strong> 2000Board, Pres. Other Board, Pres. Otherand VP (inc. employees and VP (inc. employeesbonus, etc.)bonus, etc.)Parent CompanySweden 2,318 35,783 1,440 32,590(430) (300)Denmark 0 0 0 1,149(0) (0)Great Britain 0 0 0 309(0) (0)Subsidiaries reimbursed in accordancewith consignment agreementSweden 40 16,598 0 20,555(0) (0)Denmark 0 22,254 587 16,096(0) (0)Total, Parent Company 2,358 74,635 2,027 70,699(430) (300)Subsidiaries in Sweden 0 379 1,281 16,618(0) (53)Subsidiaries elsewhereNorway 1,030 31,949 1,029 22,417(84) (104)Latvia 110 218 319 368(12) (30)Lithuania 67 454 319 274(12) (30)Total, subsidiaries 1,207 33,000 2,948 39,677(108) (217)Total, <strong>Group</strong> 3,565 107,635 4,975 110,376(538) (517)Of the Parent Company’s pension costs, SEK 1,811 thousand (preceding year 444) was for theBoard, CEO and VP. <strong>The</strong> Company’s outstanding pension commitment to these persons totals 0(preceding year 0).Of the <strong>Group</strong>’s pension costs, SEK 1,879 thousand (preceding year 444) was for the Board,CEO and VP.<strong>The</strong> <strong>Group</strong>’s outstanding pension commitment to these persons totals 0(preceding year 0).Severance payment agreements providing 2 years’ salary to the CEO and Vice President are in effect.cont.22 23
Note 7 Items affecting comparability (SEK thousands)Note 11 Deferred tax (SEK thousands)<strong>Group</strong>Parent Company<strong>2001</strong> 2000 <strong>2001</strong> 2000<strong>Group</strong>Parent company<strong>2001</strong> 2000 <strong>2001</strong> 2000Write-down of development expensescarried forward 0 –31,114 0 0Reinstatement of write-down ofdevelopment expenses 15,900 0 0 0Costs related to settlement –8,000 0 0 0Write-down of goodwill –4,165 0 0 0Other items –903 0 0 0Sales of subsidiaries 6,170 16,169 4,857 2,580SPP/Alecta refund 0 14,439 0 7,554Sale of business unit 2,277* 28,202 2,277 28,202Restructuring expenses –15,854 0 –10,283** 0Total –4,575 27,696 –3,149 38,336* WTM (Wireless Travel Management), a concept for travel reservations and information by cellular telephone,was sold during the year.** Restructuring costs for <strong>SMART</strong> Sverige AB SEK 2,626 thousand and <strong>SMART</strong> Danmark A/S SEK 2,400 thousandare included in the parent company’s items affecting comparability in accordance with the commission agreement.Note 8 Miscellaneous interest income and similar income statement items(SEK thousands)<strong>Group</strong>Parent Company<strong>2001</strong> 2000 <strong>2001</strong> 2000Interest income, external 5,060 2,846 3,003 659Interest income, internal – – 579 836Interest income, Parent Company 7,835 3,410 6,356 3,051Exchange differences 13,988 8,434 11,691 8,328Total 26,883 14,690 21,629 12,874Note 9 Interest costs and similar income statement items (SEK thousands)<strong>Group</strong>Parent Company<strong>2001</strong> 2000 <strong>2001</strong> 2000Interest costs, external 688 1,391 180 40Interest costs, internal – – 1,121 2,660Interest costs, Parent Company 17 693 17 693Exchange differences 4,876 – 4,828Write-downs of shares in subsidiaries – – – 1,416Total 705 6,960 1,318 9,637Note 10 Appropriations (SEK thousands)Parent Company<strong>2001</strong> 2000Change in tax allocation reserve –12,685 –11,072Withdrawal from tax allocation reserve 0 181Total –12,685 –10,891Deferred tax liabilities 16,111 11,563 0 0Deferred tax receivables, can be set off –12,689 –3,074 –1,924 –2,637Deferred tax liabilities 3,422 8,489 0 0Deferred tax receivables, cannot be set off –545 –358 0 0Deferred tax liabilities, net 2,877 8,131 –1,924 –2,637<strong>The</strong> <strong>Group</strong>’s deferred tax liabilities, net, have changed during the year as follows:<strong>Group</strong>Parent company<strong>2001</strong> 2000 <strong>2001</strong> 2000Balance brought forward 8,131 3,158 –2,637 –3,360Taken up as income for the year –4,254 4,973 713 723Increase deferred taxes, not taken up –1,000 0 0 0Exchange rate differencesClosing balance 2,877 8,131 –1,924 –2,637<strong>The</strong> <strong>Group</strong>’s and the subsidiaries’ most important deferred tax liabilities are indicated in the tablesbelow in categories and how the liabilities and claims have changed during <strong>2001</strong>.<strong>The</strong> <strong>Group</strong>Deferred tax liabilitiesAllocationCapital assets reserve funds Other TotalBalance brought forward 0 10,540 1,023 11,563Income taken up during the year 0 4,117 431 4,548Closing balance 0 14,657 1,454 16,111Deferred tax receivablesDeficitCapital assets deductions Other TotalBalance brought forward 3,073 0 358 3,431Income taken up during the year –794 6,211 3,386 8,803Increase of deferred taxes,not taken up 0 0 1,000 1,000Closing balance 2,279 6,211 4,744 13,234Parent companyDeferred tax receivablesAllocationCapital assets reserve funds Other TotalBalance brought forward 2,637 0 0 2,637Income taken up during the year –713 0 0 –713Closing balance 1,924 1,92424 25
Note 12 Research and development expenses brought forward (SEK thousands)<strong>Group</strong>31-12-<strong>2001</strong> 31-12-2000Acquisition value on 1 Jan. 31,114 46,205Acquisition value attributableto sold subsidiaries –23,534Purchases during the year 0 8,443Adjustment of acquisition value* –15,900 0Accumulated acquisition value on 31 Dec. 15,214 31,114Opening depreciations and write-downs –31,114 –23,419Refers to opening write-downs anddepreciations attributable to soldsubsidiaries 0 23,419Write-back of this year’s depreciations 15,900 –31,114Accumulated carried forward write-offsand depreciations –15,214 –31,114Closing planned net book value 0 0*Adjustments attributable to settlements with suppliers.Note 13 Goodwill (SEK thousands)<strong>Group</strong>31-12-<strong>2001</strong> 31-12-2000Acquisition value on 1 Jan. 4,165 16,844Sales/disposals 0 –16,844Reclassifications 0 4,165Accumulated acquisition value on 31 Dec. 4,165 4,165Depreciation according to plan on 1 Jan. 0 –8,854Sales/disposals 0 10,186Depreciation according to plan during the year 0 –918Accumulated depr. according to plan on 31 Dec. 0 414Opening balance, write-downs 0 –414Write-downs –4,165 0Planned residual value on 31 Dec. 0 4,165Note 14 Equipment and tools, computer equipment (SEK thousands)<strong>Group</strong>Parent Company31-12-<strong>2001</strong> 31-12-2000 31-12-<strong>2001</strong> 31-12-2000Acquisition value on 1 Jan. 173,228 175,157 109,756 108,138Purchases during the year 3,762 8,167 2,132 5,675Sales/disposals –19,707 –4,654 –12,044 –4,057Reclassifications/exchange differences 169 –5,442 0 0Accumulated acquisition value on 31 Dec. 157,452 173,228 99,844 109,756Depreciation according to plan on 1 Jan. –158,163 –150,763 –100,065 –93,566Sales/disposals 18,489 3,328 12,044 2,758Reclassifications/exchange differences 78 3,573 323 4Depreciation according to planduring the year –9,013 –14,301 –6 025 –9,261Acc. depr. according to plan on 31 Dec. –148,609 –158,163 –93,723 –100,065Note 15 Shares in <strong>Group</strong> companies (SEK thousands)Name of company Co. reg. no. Headquarters Shareholders’ Profit/lossequity<strong>SMART</strong> Sverige AB 556277-9461 Stockholm 33,809 3,127<strong>SMART</strong> Norge AS 937 396 783 Oslo 42,626 3,483<strong>SMART</strong> Danmark A/S 107 990 Copenhagen 26,883 1,552<strong>SMART</strong> Lettland SIA LV 40003269337 Riga 362 237<strong>SMART</strong> Litauen UAB LT 115686314 Vilnius 535 430BOKSER Travel AB 556520-6132 Stockholm 4,963 838Americs AB 556586-1340 Stockholm 91 0At the start of financial year <strong>2001</strong>, all shares in the subsidiary FM Partner AB were sold to the Norwegiancompany LAN International in the ITERA <strong>Group</strong> for SEK 8 million. No <strong>2001</strong> sales were accounted for byFM Partner AB. <strong>The</strong> sale resulted in capital gains of SEK 6.2 million, which was accounted for underitems affecting comparability.Size of holding Value of holdingNumber Percentage Book valueName of company of shares <strong>2001</strong><strong>SMART</strong> Sverige AB 49,950 78.3 10,283<strong>SMART</strong> Norge AS 4,200 70.0 3,970<strong>SMART</strong> Danmark A/S 5,000 100.0 4,438<strong>SMART</strong> Lettland SIA 95 95.0 23<strong>SMART</strong> Litauen UAB 95 95.0 16BOKSER Travel AB 20,000 100.0 7,028 1Americs AB 100 100.0 10025,8581Acquisition value 3,000Infusion of capital 1998 8,500Infusion of capital 2000 7,140Infusion of capital <strong>2001</strong> 988Write-down –12,6007,028Note 16 Other shares and security holdings<strong>Group</strong>Parent CompanyName of company Pct. of shares Book value Pct. of shares Book valueICSA T NV 10 30,000 10 30,000Nordea (Unibank) 0 62 0 0– 30,062 – 30,000ICSA T NV is to a certain extent active within the same area and contributes to the ability to coordinateefforts in the future.Note 17 Accounts receivable, Parent Company<strong>The</strong> total on 31-12-<strong>2001</strong> includes liquid funds in an intra-<strong>Group</strong> account (the <strong>Group</strong> SEK 74,492thousand, the Parent Company SEK 74,492 thousand), other short-term placements (the <strong>Group</strong>SEK 121,938 thousand, the Parent Company SEK 100,288 thousand) and the net of accounts receivableand liabilities.Planned residual value on 31 Dec. 8,843 15,065 6,121 9,69126 27
Note 18 Prepaid expenses and accrued income (SEK thousands)<strong>Group</strong>Parent Company31-12-<strong>2001</strong> 31-12-2000 31-12-<strong>2001</strong> 31-12-2000Prepaid rent 1,875 1,905 1,875 1,866Accrued interest income 150 1,135 150 0Accrued income 57,332 74,094 26,160 25,297Prepaid expenses 9,569 16,769 3,528 16,333Other items 2,365 2,516 0 1,131Total 71,291 96,419 31,713 44,627Note 19 Change in shareholders’ equity (SEK thousands)Share Restricted Non-restricted Profit for<strong>Group</strong> capital reserves reserves the yearAmount on 1 Jan. 20,000 42,334 56,905 33,313Change in conversion difference 0 0 4 672 –1,337Adjustment of OB due to deferred tax/tax recoverable 20,000 42,334 61,577 31,976Translation differences, etc 0 1,158 2,899 0Dividend 0 0 –63,690 0Transfers between restricted andnon-restricted equity 0 11,177 –11,177 0Distribution of profit by AnnualGeneral Meeting 0 0 33,313 –33,313Change in conversion difference 0 0 –1,337 1,337Profit for the year 0 0 0 59,323Amount on 31 Dec. 20,000 54,669 21,585 59,323Share Restricted Non-restricted Profit forParent Company capital reserves reserves the yearAmount on 1 Jan. 20,000 4,000 42,371 21,319Change in conversion difference 0 0 3,360 –723Adjustment of OB due to deferred tax/tax recoverable 20,000 4,000 45,731 20,596Dividend 0 0 –63,690 0Distribution of profit by AnnualGeneral Meeting 0 0 21,319 –21,319Change in conversion difference 0 0 –723 723Profit for the year 0 0 0 32,668Amount on 31 Dec. 20,000 4,000 2,637 32,668Note 20 Minority interests (SEK thousands)<strong>Group</strong>31-12-<strong>2001</strong> 31-12-2000Minority owners’ share of equity 21,246 12,069Receivable from minority owners 0 –15,246Change in conversion difference 0 95Total 21,246 –3,082Note 21 Untaxed reserves (SEK thousands)Parent Company31-12-<strong>2001</strong> 31-12-2000Tax allocation reserve tax 96 0 2,100Tax allocation reserve tax 97 9,510 9,510Tax allocation reserve tax 98 2,909 2,909Tax allocation reserve tax 99 3,700 3,700Tax allocation reserve tax 00 3,603 3,603Tax allocation reserve tax 01 10,556 11,072Tax allocation reserve tax 02 15,301 0Total 45,579 32,894Note 22 Accrued expenses and prepaid income (SEK thousands)<strong>Group</strong>Parent Company31-12-<strong>2001</strong> 31-12-2000 31-12-<strong>2001</strong> 31-12-2000Accrued holiday pay 10,891 10,218 3,697 2,855Accrued social welfare contributions 4,268 5,564 2,721 2,189Prepaid income 32,689 21,654 0 0Discounts to customers 79,121 106,790 0 0Other items 62,791 66,252 35,681 56,374Total 189,760 210,478 42,099 61,418Note 23 Pledged assets (SEK thousands)<strong>Group</strong>Parent Company31-12-<strong>2001</strong> 31-12-2000 31-12-<strong>2001</strong> 31-12-2000Chattel mortgages none none none noneNote 24 Contingent liabilities (SEK thousands)<strong>Group</strong>Parent Company31-12-<strong>2001</strong> 31-12-2000 31-12-<strong>2001</strong> 31-12-2000Other contingent liabilities 852 772 852 772Total 852 722 852 772<strong>The</strong> parent company has committed to providing 51 per cent of any customer demands in ongoingconciliation negotiations with customers.Note 25 Operational leasing (SEK thousands)Future obligations according to operational lease agreement have been entered into as follows:Amount due <strong>Group</strong> Parent Company2002 12,630 7,8742003 11,457 8,1262004 138 0Total 24,225 16,000<strong>The</strong> total amount of paid leasing fees was SEK 13,666 thousand for the <strong>Group</strong> and SEK 6,345 thousand forthe parent company for <strong>2001</strong>.28 29
Stockholm 29 May 2002Board of DirectorsMats Mitsell Benny Zakrisson David V. JonesPRESIDENTMats FagerlundSören JespersenCHAIRMANAudit reportTo the Annual General Meeting of <strong>Scandinavia</strong>n Multi Access Systems <strong>SMART</strong> ABCompany Registration Number 556051-4571Sören Jespersen(1957)SAS – Chairman,Senior VicePresident WorldSales. Chairmansince June <strong>2001</strong>.Mats Mitsell (1947)<strong>SMART</strong> – Presidentand <strong>Group</strong> CEO.Board membersince May 1993.I have examined the annual report, consolidated financial statements, and accounting records, aswell as the administration of <strong>Scandinavia</strong>n Multi Access Systems <strong>SMART</strong> AB by the Board of Directorsand the Chief Executive Officer in respect to the <strong>2001</strong> financial year.<strong>The</strong> Board of Directors and the CEO bear responsibility for the accounting documentsand administration. My responsibility is to express an opinion on the annual report, consolidatedfinancial statements, and administration on the basis of my audit.My audit was carried out in accordance with generally accepted Swedish auditing practice.This means that I planned and conducted the audit in such a way as to assure myself to a reasonabledegree that the annual report and consolidated financial statements do not contain material errors.An audit consists of examining a selection of the documents showing figures and other informationin the accounting records. An audit also includes scrutiny of the accounting policies and theirapplication by the Board and the CEO, together with an assessment of the information as a wholein the annual report and consolidated financial statements. I have examined important decisions,measures, and circumstances within the Company in order to be able to judge whether any Boardmember or the CEO is liable for damages vis-à-vis the Company, or in any other way has actedcontrary to the Swedish Companies Act, the Swedish Annual Accounts Act, or the Company’sarticles of association. I consider that my audit has provided me with a reasonable basis for mystatements below.<strong>The</strong> annual report and the consolidated financial statements have been prepared in accordancewith the Swedish Annual Accounts Act and thus provide an accurate reflection of the Company’sand the <strong>Group</strong>’s earnings and position in accordance with generally accepted Swedish auditingpractice.I recommend that the income statement and balance sheet for the Parent Company and the<strong>Group</strong> be adopted, that the profit of the Parent Company be distributed in accordance with therecommendation contained in the administration report, and that the Board members and theCEO be discharged from liability in respect to the financial year.Stockholm 5 June 2002Jan Åke MagnusonAUTHORISED PUBLIC ACCOUNTANTMats Fagerlund(1957)SAS ‒ Vice PresidentSales & DistributionServices.Board membersince <strong>2001</strong>.Benny Zakrisson(1959)SAS – Vice PresidentCorporate Advisory.Board membersince <strong>2001</strong>.David V. Jones(1943)Amadeus – ExecutiveVice PresidentCommercial.Board member sinceSeptember 1998.3031
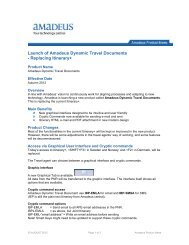
<strong>Group</strong> management at <strong>SMART</strong>Five-year summarySEK millions <strong>2001</strong> 2000 1999 1998 1997Operating income 549.8 590.5 699.9 627.8 509.2Operating income before depreciation 68.9 40.3 36.7 38.6 27.7Pretax profit 86.0 32.8 19.3 16.0 7.0Profit for the year 59.3 32.0 12.0 8.9 3.4SEK millionsFixed assets 43.8 57.0 55.7 64.2 46.1Current assets 393.0 432.0 382.6 300.9 265.0Total assets 436.8 489.0 438.3 365.1 311.1SEK millionsShareholders’ equity 155.6 155.9 117.9 108.6 97.6Minority interests 21.2 –3.1 13.5 18.0 13.5Allocation to reserves 9.6 8.5 6.9 5.8 0.0Long-term liabilities 0.0 0.0 73.4 43.5 8.4Current liabilities 250.4 327.7 226.6 189.1 191.6Total liabilities and shareholders’ equity 436.8 489.0 438.3 365.0 311.1Investments in tangiblefixed assets 3.8 8.2 15.4 20.8 15.9Investments in intangiblefixed assets 0.0 8.4 15.0 22.4 15.0Gross profit margin % 12.5 6.8 5.2 6.1 5.5Net profit margin % 15.6 5.6 2.8 2.5 1.4Return on capital employed % 52.7 22.9 15.3 16.6 4.4Return on equity % 38.1 23.4 10.6 8.6 3.4Equity/assets ratio % 40.5 31.2 29.9 34.7 35.7Number of travel agency workstations 12,311 12,563 11,431 11,106 10,793Number of days of training under<strong>SMART</strong> management 10,100 9,981 8,032 8,339 7,810Response time % 99 99 98 97 98Total number of employees 249 298 353 290 253DefinitionsBack row: Espen Stendal, Travel Agency Sales Division, Knut Fredrik Strøm, Customer Services Division,Lilly Rakic, Business Control, Peter Rathsmann, Amadeus Relations & Market Communication,Per Matson, Legal & Purchase, Jesper Söderström, Product Division.Front row: Robert Kviberg, IT Division, JanChrister Egnefors, COO, Eric Petri, Human Resources & Administration.Gross profit marginProfit before depreciation as a percentage of operatingincome.Net profit marginPretax profit as a percentage of operating income.Capital employedTotal assets less interest-free liabilities.Return on capital employedOperating income after depreciation plus interest income,as a percentage of average capital employed.Return on equityProfit for the year as a percentage of averageshareholders’ equity.Equity/assets ratioShareholders’ equity plus minority interests as apercentage of total assets.Response timePercentage of responses made in less thanfour seconds.32