The SMART Group SMART ANNUAL REPORT 2001 - Scandinavia
The SMART Group SMART ANNUAL REPORT 2001 - Scandinavia
The SMART Group SMART ANNUAL REPORT 2001 - Scandinavia
- No tags were found...

Create successful ePaper yourself
Turn your PDF publications into a flip-book with our unique Google optimized e-Paper software.
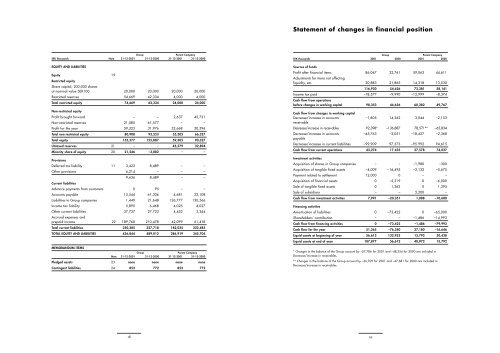
Statement of changes in financial position<strong>Group</strong>Parent CompanySEK thousands Note 31-12-<strong>2001</strong> 31-12-2000 31-12-<strong>2001</strong> 31-12-2000<strong>Group</strong>Parent CompanySEK thousands <strong>2001</strong> 2000 <strong>2001</strong> 2000EQUITY AND LIABILITIESEquity 19Restricted equityShare capital, 200,000 sharesat nominal value SEK100 20,000 20,000 20,000 20,000Restricted reserves 54,669 42,334 4,000 4,000Total restricted equity 74,669 62,334 24,000 24,000Non-restricted equityProfit brought forward – – 2,637 45,731Non-restricted reserves 21,585 61,577 – –Profit for the year 59,323 31,976 32,668 20,596Total non-restricted equity 80,908 93,553 35,305 66,327Total equity 155,577 155,887 59,305 90,327Untaxed reserves 21 – – 45,579 32,894Minority share of equity 20 21,246 –3,082 – –ProvisionsDeferred tax liability 11 3,422 8,489 – –Other provisions 6,214 – – –9,636 8,489 – –Current liabilitiesAdvance payments from customers 0 95 – –Accounts payable 15,544 61,306 4,681 23,108Liabilities to <strong>Group</strong> companies 1,449 21,648 126,777 130,566Income tax liability 5,895 6,468 4,025 4,027Other current liabilities 37,737 27,723 4,453 3,364Accrued expenses andprepaid income 22 189,760 210,478 42,099 61,418Total current liabilities 250,385 327,718 182,035 222,483TOTAL EQUITY AND LIABILITIES 436,844 489,012 286,919 345,704Sources of fundsProfit after financial items 86,047 32,761 59,063 44,611Adjustments for items not affectingliquidity, etc. 30,883 21,865 14,318 13,530116,930 54,626 73,381 58,141Income tax paid –18,577 –9,990 –12,999 –8,374Cash flow from operationsbefore changes in working capital 98,353 44,636 60,382 49,767Cash flow from changes in working capitalDecrease/increase in accounts –1,805 14,362 3,044 –2,153receivableDecrease/increase in receivables 92,398* –136,887 78,571** –65,834Decrease/increase in accounts –45,763 –2,051 –18,427 –2,368payableDecrease/increase in current liabilities –99,909 97,373 –95 992 94,615Cash flow from current operations 43,274 17 433 27,578 74,027Investment activitiesAcquisition of shares in <strong>Group</strong> companies – – –1,980 –300Acquisition of tangible fixed assets –4,009 –16,495 –2,132 –5,675Payment related to settlement 12,000 0 – –Acquisition of financial assets 0 –5,219 0 –6,000Sale of tangible fixed assets 0 1,363 0 1,295Sale of subsidiary – – 5,200 –Cash flow from investment activities 7,991 –20,351 1,088 –10,680Financing activitiesAmortisation of liabilities 0 –73,422 0 –65,000Shareholders’ contribution – – –1,486 –14,993Cash flow from financing activities 0 –73,422 –1,486 –79,993Cash flow for the year 51,265 –76,340 27,180 –16,646Liquid assets at beginning of year 56,612 132,952 13,792 30,438Liquid assets at end of year 107,877 56,612 40,972 13,792MEMORANDUM ITEMS<strong>Group</strong>Parent CompanyNote 31-12-<strong>2001</strong> 31-12-2000 31-12-<strong>2001</strong> 31-12-2000Pledged assets 23 none none none noneContingent liabilities 24 852 772 852 772* Changes in the balance of the <strong>Group</strong> account by –57,786 for <strong>2001</strong> and –48,254 for 2000 are included inDecrease/increase in receivables.** Changes in the balance of the <strong>Group</strong> account by –36,709 for <strong>2001</strong> and –47,681 for 2000 are included inDecrease/increase in receivables.18 19