<strong>Aged</strong> <strong>Care</strong> & <strong>Rehabilitation</strong> <strong>Clinical</strong> Service <strong>Plan</strong> <strong>2007</strong> - <strong>2012</strong>3. THE POPULATION OF SSWAHSIn 2001, the SSWAHS population was 1.28 million. This population is projected to rise to 1.52million by 2016. As Table 3.1 indicates, the majority of the SSWAHS population reside in the southwest with the most rapid growth expected in the LGAs of Liverpool, Camden and Campbelltown,due to the large scale urban release known as the South West Growth Centre.Approximately 1.07% of SSWAHS residents identify as Aboriginal people or Torres Strait Islanders.There are considerable variations across SSWAHS in the proportion of Aboriginal residents (highestin the former South Sydney and Campbelltown LGAs). The Aboriginal population is relatively young,with more than 30% of the population under 14 years. There are approximately 1,800 Aboriginalpeople over 50 years ie 13% of the indigenous population.SSWAHS is expected to remain the most ethnically diverse health area in NSW and continue to behome to approximately half the humanitarian arrivals in NSW each year (DIMIA, 2005). The highestproportion of people who speak a language other than English at home live in Fairfield andCanterbury LGAs. With its large CALD population, it is anticipated that the number of older residentsof SSWAHS from non-English speaking countries will increase, with the size of cultural groupschanging over time, mirroring migration patterns. This group will face barriers associated with poorEnglish language and other cultural difficulties.Projections developed by Booth & Tickle suggest that by 2027 the life expectancy of non-indigenousmales could increase from 77 to 82.9 and for non-indigenous women from 82.4 to 85.1. They furtherpredict that around 50% of ‘baby boomer’ women will live to at least 90 years of age (AustralianBureau of Statistics 2001, Booth & Tickle, 2003, p4).Table 3.1 Population characteristics by LGA – 2001 Census and projections to 2016LGAAboriginal identified(2001 Census)Projected PopulationPopulation2001(Census)% Languageother thanEnglishNo. % 2001spoken athome (2001 2006 2011 2016pop Census)Sydney (part) 32,698 61 0.19% 27 37,808 41,301 45,555South Sydney(part) 25,8131,134 4.39% 21.8 29,455 33,855 38,593Leichhardt 50,450 631 1.25% 15.6 51,700 52,320 52,700Marrickville 76,770 983 1.28% 38.6 76,230 75,880 78,700Ashfield 40,540 205 0.51% 43.5 42,130 42,730 42,720Burwood 30,590 113 0.37% 52.7 32,180 34,160 35,960Strathfield 29,450 93 0.32% 53.7 33,940 37,680 41,160Canada Bay 62,350 228 0.37% 30.3 67,000 73,890 78,610Canterbury 137,520 664 0.48% 62.2 139,730 142,100 144,080Eastern Zone 486,181 4,112 0.85% 39.1 510,173 533,916 558,078Bankstown 172,030 1,303 0.76% 46.2 174,990 177,850 180,060Fairfield 189,020 1,118 0.59% 66 191,920 193,350 191,460Liverpool 159,070 2,038 1.28% 43.7 175,670 197,440 225,590Campbelltown 150,160 3,602 2.40% 19.4 154,310 164,050 179,280Camden 45,450 525 1.16% 8.5 54,630 69,020 83,030Wollondilly 38,460 577 1.50% 5.1 42,210 45,510 47,840Wingecarribee 42,760 497 1.16% 4.2 46,070 48,970 51,740Western Zone 796,950 9,660 1.21% 38.9 839,800 896,190 959,000SSWSAHS 1,283,132 13,772 1.07% 39 1,349,973 1,430,106 1,517,078NSW 6,578,980 134,888 2.05% 19 6,872,530 7,164,950 7,434,050Source:Note:DIPNR Population Projections, NSW Regional Profile 2004, ABS.Sydney (Part) and South Sydney (part) now make up City of Sydney (part)The Index of Relative Advantage/Disadvantage within the Socio-economic Index for Areas (SEIFA)data produced by the Australian Bureau of Statistics (ABS) in 2001, indicates that Bankstown,Page 20
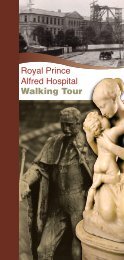
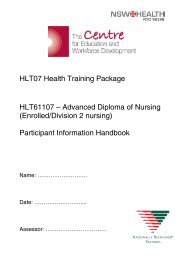
<strong>Aged</strong> <strong>Care</strong> & <strong>Rehabilitation</strong> <strong>Clinical</strong> Service <strong>Plan</strong> <strong>2007</strong> - <strong>2012</strong>Campbelltown, Canterbury, Fairfield and Liverpool LGAs are amongst the most disadvantaged LGAsin NSW. This level of disadvantage is likely to result in poorer health within the population.3.1 People aged 65+ yearsAt 2001, the SSWAHS population aged over 65 years was 136,199 (11%) projected to increase to196,841 or 13% of the total population in 2016. By 2026, this group is projected to represent 16% ofthe total population. The majority (57%) of people aged 65+ years live in the south west, howeverthere will be a significant increase in the older population across the Area, with a 61% increasebetween 2001 and 2016 in the south west and a 23% increase in the east of the Area (Figure 3.1below).Figure 3.1 Population Projections for People aged 65+ years by Zone 2001 – 2016150,000Population100,00050,0000WZEZ2001 76,970 59,2292006 87,790 61,2952011 101,980 65,1962016 123,790 73,051ZoneSource: DIPNR Population Projections (2004)3.2 People aged 85+ yearsIn 2001, the SSWAHS population aged over 85 years was 12,685 (1%) projecting to more thandouble to 25,664 (2%) of the total population by 2016 (see Figure 2.2 below). Importantly, ontoday’s figures, around 80% of this over-85 year age group is disabled in self-care abilities, with 70%having a gait disorder, 10% having Parkinson’s disease, 70% having cognitive impairment and 30%with actual dementia (Waite, et. al. 1997). Despite these patients’ disabilities, the majority of olderpeople live at home.Figure 3.2 Population Projections for people aged 85+ years by Zone 2001 – 201620,000Population15,00010,0005,0000WZEZ2001 6,590 6,9042006 8,780 7,6722011 12,200 9,1022016 15,120 10,544ZoneSource: DIPNR Population Projections 2004Page 21