Aged Care & Rehabilitation Clinical Services Plan 2007 – 2012
Aged Care & Rehabilitation Clinical Services Plan 2007 – 2012
Aged Care & Rehabilitation Clinical Services Plan 2007 – 2012

You also want an ePaper? Increase the reach of your titles
YUMPU automatically turns print PDFs into web optimized ePapers that Google loves.
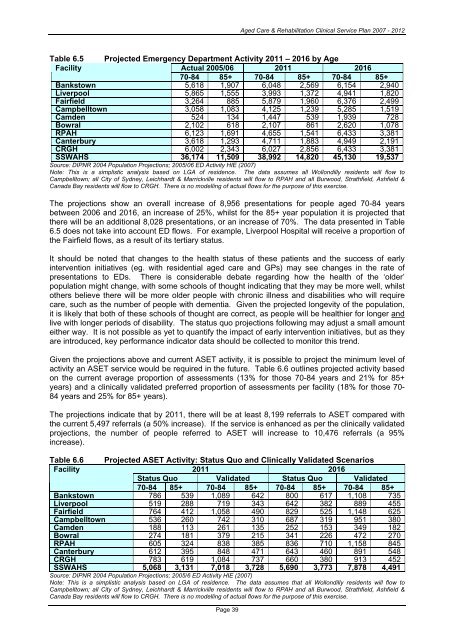
<strong>Aged</strong> <strong>Care</strong> & <strong>Rehabilitation</strong> <strong>Clinical</strong> Service <strong>Plan</strong> <strong>2007</strong> - <strong>2012</strong>Table 6.5 Projected Emergency Department Activity 2011 – 2016 by AgeFacilityActual 2005/06 2011 201670-84 85+ 70-84 85+ 70-84 85+Bankstown 5,618 1,907 6,048 2,569 6,154 2,940Liverpool 5,865 1,555 3,993 1,372 4,941 1,820Fairfield 3,264 885 5,879 1,960 6,376 2,499Campbelltown 3,058 1,083 4,125 1,239 5,285 1,519Camden 524 134 1,447 539 1,939 728Bowral 2,102 618 2,107 861 2,620 1,078RPAH 6,123 1,691 4,655 1,541 6,433 3,381Canterbury 3,618 1,293 4,711 1,883 4,949 2,191CRGH 6,002 2,343 6,027 2,856 6,433 3,381SSWAHS 36,174 11,509 38,992 14,820 45,130 19,537Source: DIPNR 2004 Population Projections; 2005/06 ED Activity HIE (<strong>2007</strong>)Note: This is a simplistic analysis based on LGA of residence. The data assumes all Wollondilly residents will flow toCampbelltown; all City of Sydney, Leichhardt & Marrickville residents will flow to RPAH and all Burwood, Strathfield, Ashfield &Canada Bay residents will flow to CRGH. There is no modelling of actual flows for the purpose of this exercise.The projections show an overall increase of 8,956 presentations for people aged 70-84 yearsbetween 2006 and 2016, an increase of 25%, whilst for the 85+ year population it is projected thatthere will be an additional 8,028 presentations, or an increase of 70%. The data presented in Table6.5 does not take into account ED flows. For example, Liverpool Hospital will receive a proportion ofthe Fairfield flows, as a result of its tertiary status.It should be noted that changes to the health status of these patients and the success of earlyintervention initiatives (eg. with residential aged care and GPs) may see changes in the rate ofpresentations to EDs. There is considerable debate regarding how the health of the ‘older’population might change, with some schools of thought indicating that they may be more well, whilstothers believe there will be more older people with chronic illness and disabilities who will requirecare, such as the number of people with dementia. Given the projected longevity of the population,it is likely that both of these schools of thought are correct, as people will be healthier for longer andlive with longer periods of disability. The status quo projections following may adjust a small amounteither way. It is not possible as yet to quantify the impact of early intervention initiatives, but as theyare introduced, key performance indicator data should be collected to monitor this trend.Given the projections above and current ASET activity, it is possible to project the minimum level ofactivity an ASET service would be required in the future. Table 6.6 outlines projected activity basedon the current average proportion of assessments (13% for those 70-84 years and 21% for 85+years) and a clinically validated preferred proportion of assessments per facility (18% for those 70-84 years and 25% for 85+ years).The projections indicate that by 2011, there will be at least 8,199 referrals to ASET compared withthe current 5,497 referrals (a 50% increase). If the service is enhanced as per the clinically validatedprojections, the number of people referred to ASET will increase to 10,476 referrals (a 95%increase).Table 6.6FacilityProjected ASET Activity: Status Quo and <strong>Clinical</strong>ly Validated Scenarios2011 2016Status Quo Validated Status Quo Validated70-84 85+ 70-84 85+ 70-84 85+ 70-84 85+Bankstown 786 539 1,089 642 800 617 1,108 735Liverpool 519 288 719 343 642 382 889 455Fairfield 764 412 1,058 490 829 525 1,148 625Campbelltown 536 260 742 310 687 319 951 380Camden 188 113 261 135 252 153 349 182Bowral 274 181 379 215 341 226 472 270RPAH 605 324 838 385 836 710 1,158 845Canterbury 612 395 848 471 643 460 891 548CRGH 783 619 1,084 737 660 380 913 452SSWAHS 5,068 3,131 7,018 3,728 5,690 3,773 7,878 4,491Source: DIPNR 2004 Population Projections; 2005/6 ED Activity HIE (<strong>2007</strong>)Note: This is a simplistic analysis based on LGA of residence. The data assumes that all Wollondilly residents will flow toCampbelltown; all City of Sydney, Leichhardt & Marrickville residents will flow to RPAH and all Burwood, Strathfield, Ashfield &Canada Bay residents will flow to CRGH. There is no modelling of actual flows for the purpose of this exercise.Page 39