Mixture Design Tutorials - Statease.info
Mixture Design Tutorials - Statease.info
Mixture Design Tutorials - Statease.info

Create successful ePaper yourself
Turn your PDF publications into a flip-book with our unique Google optimized e-Paper software.
Review Diagnostic Graphs<br />
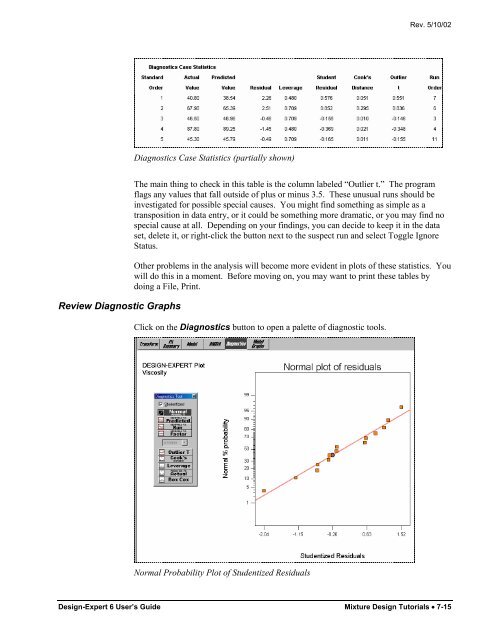
Diagnostics Case Statistics (partially shown)<br />
Rev. 5/10/02<br />
The main thing to check in this table is the column labeled “Outlier t.” The program<br />
flags any values that fall outside of plus or minus 3.5. These unusual runs should be<br />
investigated for possible special causes. You might find something as simple as a<br />
transposition in data entry, or it could be something more dramatic, or you may find no<br />
special cause at all. Depending on your findings, you can decide to keep it in the data<br />
set, delete it, or right-click the button next to the suspect run and select Toggle Ignore<br />
Status.<br />
Other problems in the analysis will become more evident in plots of these statistics. You<br />
will do this in a moment. Before moving on, you may want to print these tables by<br />
doing a File, Print.<br />
Click on the Diagnostics button to open a palette of diagnostic tools.<br />
Normal Probability Plot of Studentized Residuals<br />
<strong>Design</strong>-Expert 6 User’s Guide <strong>Mixture</strong> <strong>Design</strong> <strong>Tutorials</strong> • 7-15