Mixture Design Tutorials - Statease.info
Mixture Design Tutorials - Statease.info
Mixture Design Tutorials - Statease.info

You also want an ePaper? Increase the reach of your titles
YUMPU automatically turns print PDFs into web optimized ePapers that Google loves.
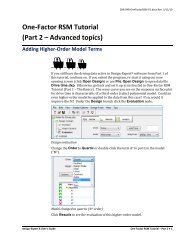
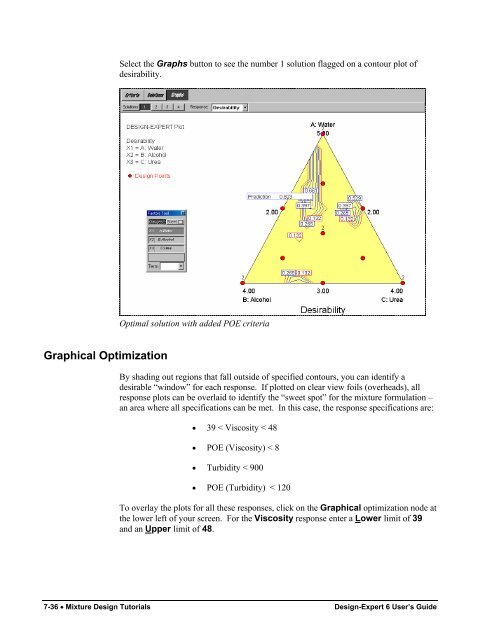
Graphical Optimization<br />
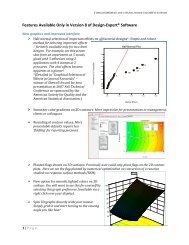
Select the Graphs button to see the number 1 solution flagged on a contour plot of<br />
desirability.<br />
Optimal solution with added POE criteria<br />
By shading out regions that fall outside of specified contours, you can identify a<br />
desirable “window” for each response. If plotted on clear view foils (overheads), all<br />
response plots can be overlaid to identify the “sweet spot” for the mixture formulation –<br />
an area where all specifications can be met. In this case, the response specifications are:<br />
•<br />
•<br />
•<br />
•<br />
39 < Viscosity < 48<br />
POE (Viscosity) < 8<br />
Turbidity < 900<br />
POE (Turbidity) < 120<br />
To overlay the plots for all these responses, click on the Graphical optimization node at<br />
the lower left of your screen. For the Viscosity response enter a Lower limit of 39<br />
and an Upper limit of 48.<br />
7-36 • <strong>Mixture</strong> <strong>Design</strong> <strong>Tutorials</strong> <strong>Design</strong>-Expert 6 User’s Guide