Chapter 5 Control Charts For Variables
Chapter 5 Control Charts For Variables
Chapter 5 Control Charts For Variables
- No tags were found...
Create successful ePaper yourself
Turn your PDF publications into a flip-book with our unique Google optimized e-Paper software.
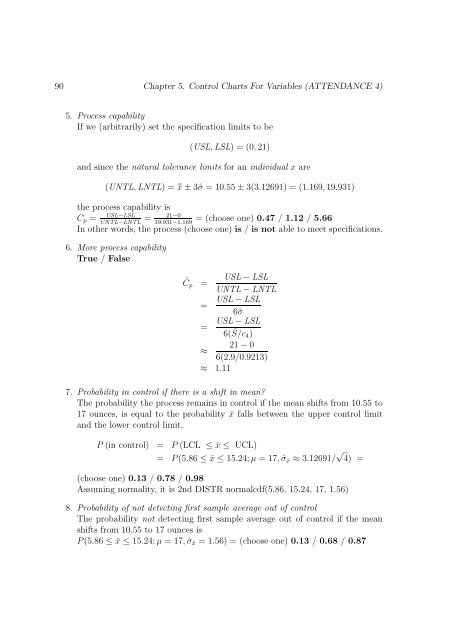
90 <strong>Chapter</strong> 5. <strong>Control</strong> <strong>Charts</strong> <strong>For</strong> <strong>Variables</strong> (ATTENDANCE 4)5. Process capabilityIf we (arbitrarily) set the specification limits to be(USL, LSL) = (0, 21)and since the natural tolerance limits for an individual x are(UNTL, LNTL) = ¯x ± 3ˆσ = 10.55 ± 3(3.12691) = (1.169, 19.931)the process capability isC p =USL−LSL = 21−0= (choose one) 0.47 / 1.12 / 5.66UNTL−LNTL 19.931−1.169In other words, the process (choose one) is / is not able to meet specifications.6. More process capabilityTrue / FalseĈ p =USL − LSLUNTL − LNTL=USL − LSL6ˆσ=USL − LSL6( ¯S/c 4 )≈21 − 06(2.9/0.9213)≈ 1.117. Probability in control if there is a shift in mean?The probability the process remains in control if the mean shifts from 10.55 to17 ounces, is equal to the probability ¯x falls between the upper control limitand the lower control limit,P (in control) = P (LCL ≤ ¯x ≤ UCL)= P (5.86 ≤ ¯x ≤ 15.24; µ = 17, ˆσ¯x ≈ 3.12691/ √ 4) =(choose one) 0.13 / 0.78 / 0.98Assuming normality, it is 2nd DISTR normalcdf(5.86, 15.24, 17, 1.56)8. Probability of not detecting first sample average out of controlThe probability not detecting first sample average out of control if the meanshifts from 10.55 to 17 ounces isP (5.86 ≤ ¯x ≤ 15.24; µ = 17, ˆσ¯x = 1.56) = (choose one) 0.13 / 0.68 / 0.87


