Chapter 5 Control Charts For Variables
Chapter 5 Control Charts For Variables
Chapter 5 Control Charts For Variables
- No tags were found...

Create successful ePaper yourself
Turn your PDF publications into a flip-book with our unique Google optimized e-Paper software.
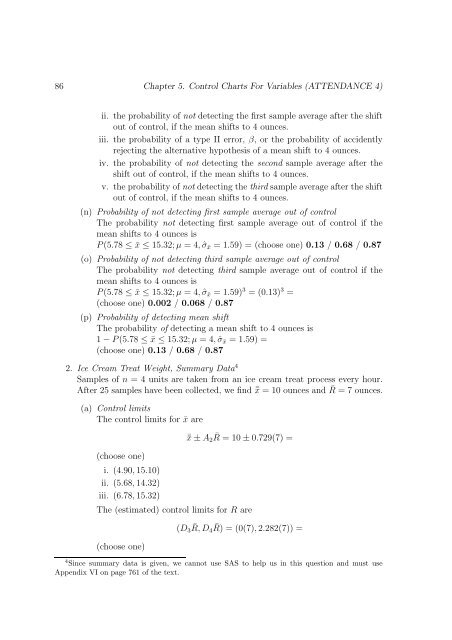
86 <strong>Chapter</strong> 5. <strong>Control</strong> <strong>Charts</strong> <strong>For</strong> <strong>Variables</strong> (ATTENDANCE 4)ii. the probability of not detecting the first sample average after the shiftout of control, if the mean shifts to 4 ounces.iii. the probability of a type II error, β, or the probability of accidentlyrejecting the alternative hypothesis of a mean shift to 4 ounces.iv. the probability of not detecting the second sample average after theshift out of control, if the mean shifts to 4 ounces.v. the probability of not detecting the third sample average after the shiftout of control, if the mean shifts to 4 ounces.(n) Probability of not detecting first sample average out of controlThe probability not detecting first sample average out of control if themean shifts to 4 ounces isP (5.78 ≤ ¯x ≤ 15.32; µ = 4, ˆσ¯x = 1.59) = (choose one) 0.13 / 0.68 / 0.87(o) Probability of not detecting third sample average out of controlThe probability not detecting third sample average out of control if themean shifts to 4 ounces isP (5.78 ≤ ¯x ≤ 15.32; µ = 4, ˆσ¯x = 1.59) 3 = (0.13) 3 =(choose one) 0.002 / 0.068 / 0.87(p) Probability of detecting mean shiftThe probability of detecting a mean shift to 4 ounces is1 − P (5.78 ≤ ¯x ≤ 15.32; µ = 4, ˆσ¯x = 1.59) =(choose one) 0.13 / 0.68 / 0.872. Ice Cream Treat Weight, Summary Data 4Samples of n = 4 units are taken from an ice cream treat process every hour.After 25 samples have been collected, we find ¯x = 10 ounces and ¯R = 7 ounces.(a) <strong>Control</strong> limitsThe control limits for ¯x are¯x ± A 2 ¯R = 10 ± 0.729(7) =(choose one)i. (4.90, 15.10)ii. (5.68, 14.32)iii. (6.78, 15.32)The (estimated) control limits for R are(choose one)(D 3 ¯R, D4 ¯R) = (0(7), 2.282(7)) =4 Since summary data is given, we cannot use SAS to help us in this question and must useAppendix VI on page 761 of the text.