Chapter 5 Control Charts For Variables
Chapter 5 Control Charts For Variables
Chapter 5 Control Charts For Variables
- No tags were found...

You also want an ePaper? Increase the reach of your titles
YUMPU automatically turns print PDFs into web optimized ePapers that Google loves.
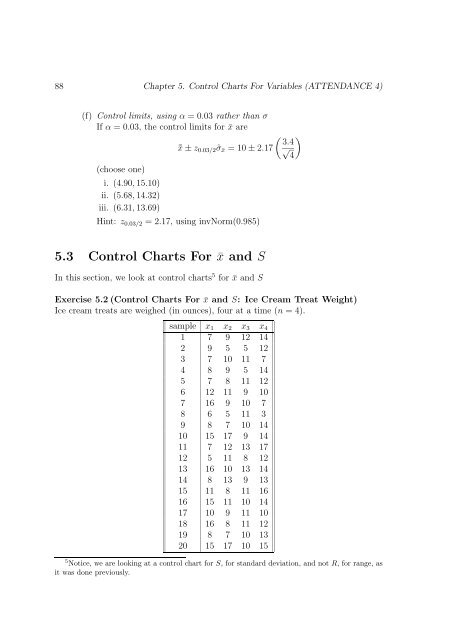
88 <strong>Chapter</strong> 5. <strong>Control</strong> <strong>Charts</strong> <strong>For</strong> <strong>Variables</strong> (ATTENDANCE 4)(f) <strong>Control</strong> limits, using α = 0.03 rather than σIf α = 0.03, the control limits for ¯x are(choose one)i. (4.90, 15.10)ii. (5.68, 14.32)iii. (6.31, 13.69)¯x ± z 0.03/2ˆσ¯x = 10 ± 2.17Hint: z 0.03/2 = 2.17, using invNorm(0.985)( ) 3.4√45.3 <strong>Control</strong> <strong>Charts</strong> <strong>For</strong> ¯x and SIn this section, we look at control charts 5 for ¯x and SExercise 5.2 (<strong>Control</strong> <strong>Charts</strong> <strong>For</strong> ¯x and S: Ice Cream Treat Weight)Ice cream treats are weighed (in ounces), four at a time (n = 4).sample x 1 x 2 x 3 x 41 7 9 12 142 9 5 5 123 7 10 11 74 8 9 5 145 7 8 11 126 12 11 9 107 16 9 10 78 6 5 11 39 8 7 10 1410 15 17 9 1411 7 12 13 1712 5 11 8 1213 16 10 13 1414 8 13 9 1315 11 8 11 1616 15 11 10 1417 10 9 11 1018 16 8 11 1219 8 7 10 1320 15 17 10 155 Notice, we are looking at a control chart for S, for standard deviation, and not R, for range, asit was done previously.