Chapter 5 Control Charts For Variables
Chapter 5 Control Charts For Variables
Chapter 5 Control Charts For Variables
- No tags were found...

You also want an ePaper? Increase the reach of your titles
YUMPU automatically turns print PDFs into web optimized ePapers that Google loves.
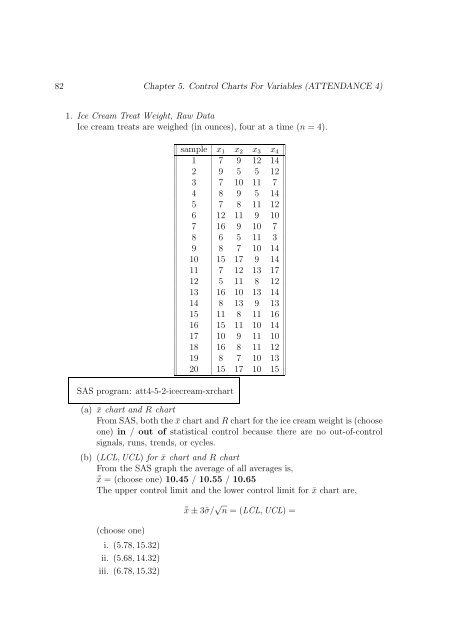
82 <strong>Chapter</strong> 5. <strong>Control</strong> <strong>Charts</strong> <strong>For</strong> <strong>Variables</strong> (ATTENDANCE 4)1. Ice Cream Treat Weight, Raw DataIce cream treats are weighed (in ounces), four at a time (n = 4).sample x 1 x 2 x 3 x 41 7 9 12 142 9 5 5 123 7 10 11 74 8 9 5 145 7 8 11 126 12 11 9 107 16 9 10 78 6 5 11 39 8 7 10 1410 15 17 9 1411 7 12 13 1712 5 11 8 1213 16 10 13 1414 8 13 9 1315 11 8 11 1616 15 11 10 1417 10 9 11 1018 16 8 11 1219 8 7 10 1320 15 17 10 15SAS program: att4-5-2-icecream-xrchart(a) ¯x chart and R chartFrom SAS, both the ¯x chart and R chart for the ice cream weight is (chooseone) in / out of statistical control because there are no out-of-controlsignals, runs, trends, or cycles.(b) (LCL, UCL) for ¯x chart and R chartFrom the SAS graph the average of all averages is,¯x = (choose one) 10.45 / 10.55 / 10.65The upper control limit and the lower control limit for ¯x chart are,(choose one)i. (5.78, 15.32)ii. (5.68, 14.32)iii. (6.78, 15.32)¯x ± 3ˆσ/ √ n = (LCL, UCL) =