Chapter 5 Control Charts For Variables
Chapter 5 Control Charts For Variables
Chapter 5 Control Charts For Variables
- No tags were found...
Create successful ePaper yourself
Turn your PDF publications into a flip-book with our unique Google optimized e-Paper software.
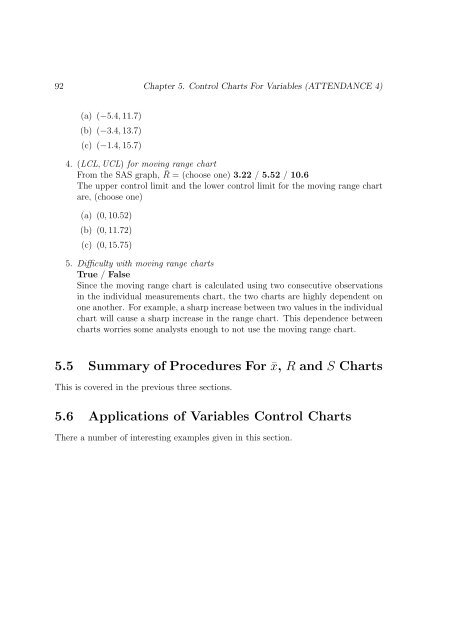
92 <strong>Chapter</strong> 5. <strong>Control</strong> <strong>Charts</strong> <strong>For</strong> <strong>Variables</strong> (ATTENDANCE 4)(a) (−5.4, 11.7)(b) (−3.4, 13.7)(c) (−1.4, 15.7)4. (LCL, UCL) for moving range chartFrom the SAS graph, ¯R = (choose one) 3.22 / 5.52 / 10.6The upper control limit and the lower control limit for the moving range chartare, (choose one)(a) (0, 10.52)(b) (0, 11.72)(c) (0, 15.75)5. Difficulty with moving range chartsTrue / FalseSince the moving range chart is calculated using two consecutive observationsin the individual measurements chart, the two charts are highly dependent onone another. <strong>For</strong> example, a sharp increase between two values in the individualchart will cause a sharp increase in the range chart. This dependence betweencharts worries some analysts enough to not use the moving range chart.5.5 Summary of Procedures <strong>For</strong> ¯x, R and S <strong>Charts</strong>This is covered in the previous three sections.5.6 Applications of <strong>Variables</strong> <strong>Control</strong> <strong>Charts</strong>There a number of interesting examples given in this section.


