Chapter 5 Control Charts For Variables
Chapter 5 Control Charts For Variables
Chapter 5 Control Charts For Variables
- No tags were found...

You also want an ePaper? Increase the reach of your titles
YUMPU automatically turns print PDFs into web optimized ePapers that Google loves.
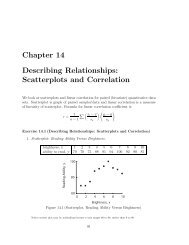
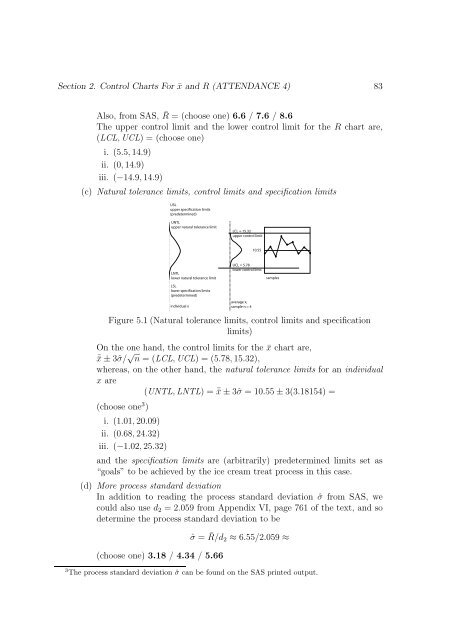
Section 2. <strong>Control</strong> <strong>Charts</strong> <strong>For</strong> ¯x and R (ATTENDANCE 4) 83Also, from SAS, ¯R = (choose one) 6.6 / 7.6 / 8.6The upper control limit and the lower control limit for the R chart are,(LCL, UCL) = (choose one)i. (5.5, 14.9)ii. (0, 14.9)iii. (−14.9, 14.9)(c) Natural tolerance limits, control limits and specification limitsUSLupper specification limits(predetermined)UNTLupper natural tolerance limitLCL = 15.32upper control limit10.55LNTLlower natural tolerance limitLSLlower specification limits(predetermined)individual xUCL = 5.78lower control limitaverage x,sample n = 4Figure 5.1 (Natural tolerance limits, control limits and specificationlimits)On the one hand, the control limits for the ¯x chart are,¯x ± 3ˆσ/ √ n = (LCL, UCL) = (5.78, 15.32),whereas, on the other hand, the natural tolerance limits for an individualx are(UNTL, LNTL) = ¯x ± 3ˆσ = 10.55 ± 3(3.18154) =(choose one 3 )i. (1.01, 20.09)ii. (0.68, 24.32)iii. (−1.02, 25.32)and the specification limits are (arbitrarily) predetermined limits set as“goals” to be achieved by the ice cream treat process in this case.(d) More process standard deviationIn addition to reading the process standard deviation ˆσ from SAS, wecould also use d 2 = 2.059 from Appendix VI, page 761 of the text, and sodetermine the process standard deviation to be(choose one) 3.18 / 4.34 / 5.66samplesˆσ = ¯R/d 2 ≈ 6.55/2.059 ≈3 The process standard deviation ˆσ can be found on the SAS printed output.