Chapter 5 Control Charts For Variables
Chapter 5 Control Charts For Variables
Chapter 5 Control Charts For Variables
- No tags were found...

You also want an ePaper? Increase the reach of your titles
YUMPU automatically turns print PDFs into web optimized ePapers that Google loves.
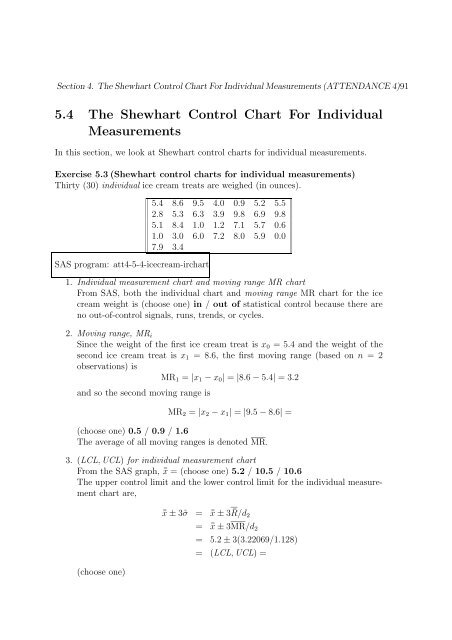
Section 4. The Shewhart <strong>Control</strong> Chart <strong>For</strong> Individual Measurements (ATTENDANCE 4)915.4 The Shewhart <strong>Control</strong> Chart <strong>For</strong> IndividualMeasurementsIn this section, we look at Shewhart control charts for individual measurements.Exercise 5.3 (Shewhart control charts for individual measurements)Thirty (30) individual ice cream treats are weighed (in ounces).SAS program: att4-5-4-icecream-irchart5.4 8.6 9.5 4.0 0.9 5.2 5.52.8 5.3 6.3 3.9 9.8 6.9 9.85.1 8.4 1.0 1.2 7.1 5.7 0.61.0 3.0 6.0 7.2 8.0 5.9 0.07.9 3.41. Individual measurement chart and moving range MR chartFrom SAS, both the individual chart and moving range MR chart for the icecream weight is (choose one) in / out of statistical control because there areno out-of-control signals, runs, trends, or cycles.2. Moving range, MR iSince the weight of the first ice cream treat is x 0 = 5.4 and the weight of thesecond ice cream treat is x 1 = 8.6, the first moving range (based on n = 2observations) isMR 1 = |x 1 − x 0 | = |8.6 − 5.4| = 3.2and so the second moving range isMR 2 = |x 2 − x 1 | = |9.5 − 8.6| =(choose one) 0.5 / 0.9 / 1.6The average of all moving ranges is denoted MR.3. (LCL, UCL) for individual measurement chartFrom the SAS graph, ¯x = (choose one) 5.2 / 10.5 / 10.6The upper control limit and the lower control limit for the individual measurementchart are,(choose one)¯x ± 3ˆσ = ¯x ± 3 ¯R/d 2= ¯x ± 3MR/d 2= 5.2 ± 3(3.22069/1.128)= (LCL, UCL) =