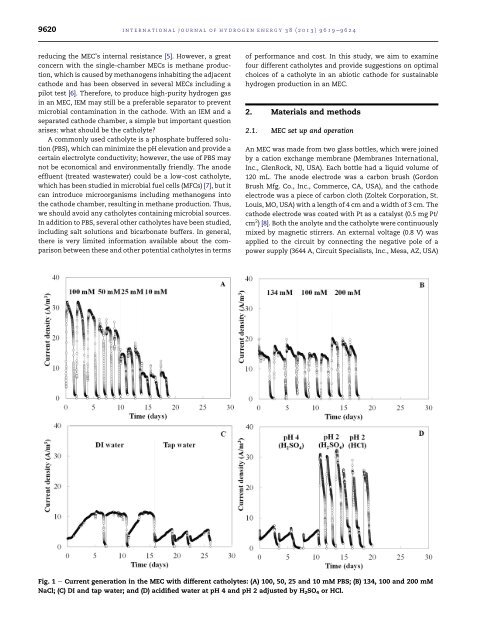
9620<strong>in</strong>ternational journal <strong>of</strong> hydrogen energy 38 (2013) 9619e9624reduc<strong>in</strong>g the MEC’s <strong>in</strong>ternal resistance [5]. However, a greatconcern with the s<strong>in</strong>gle-chamber MECs is methane <strong>production</strong>,which is caused by methanogens <strong>in</strong>habit<strong>in</strong>g the adjacentcathode and has been observed <strong>in</strong> several MECs <strong>in</strong>clud<strong>in</strong>g apilot test [6]. Therefore, to produce high-purity hydrogen gas<strong>in</strong> an MEC, IEM may still be a preferable separator to prevent<strong>microbial</strong> contam<strong>in</strong>ation <strong>in</strong> the cathode. With an IEM and aseparated cathode chamber, a simple but important questionarises: what should be the <strong>catholyte</strong>?A commonly used <strong>catholyte</strong> is a phosphate buffered solution(PBS), which can m<strong>in</strong>imize the pH elevation and provide acerta<strong>in</strong> electrolyte conductivity; however, the use <strong>of</strong> PBS maynot be economical and environmentally friendly. The anodeeffluent (treated wastewater) could be a low-cost <strong>catholyte</strong>,which has been studied <strong>in</strong> <strong>microbial</strong> fuel <strong>cells</strong> (MFCs) [7], but itcan <strong>in</strong>troduce microorganisms <strong>in</strong>clud<strong>in</strong>g methanogens <strong>in</strong>tothe cathode chamber, result<strong>in</strong>g <strong>in</strong> methane <strong>production</strong>. Thus,we should avoid any <strong>catholyte</strong>s conta<strong>in</strong><strong>in</strong>g <strong>microbial</strong> sources.In addition to PBS, several other <strong>catholyte</strong>s have been studied,<strong>in</strong>clud<strong>in</strong>g salt solutions and bicarbonate buffers. In general,there is very limited <strong>in</strong>formation available about the comparisonbetween these and other potential <strong>catholyte</strong>s <strong>in</strong> terms<strong>of</strong> performance and cost. In this study, we aim to exam<strong>in</strong>efour different <strong>catholyte</strong>s and provide suggestions on optimalchoices <strong>of</strong> a <strong>catholyte</strong> <strong>in</strong> an abiotic cathode for susta<strong>in</strong>ablehydrogen <strong>production</strong> <strong>in</strong> an MEC.2. Materials and methods2.1. MEC set up and operationAn MEC was made from two glass bottles, which were jo<strong>in</strong>edby a cation exchange membrane (Membranes International,Inc., GlenRock, NJ, USA). Each bottle had a liquid volume <strong>of</strong>120 mL. The anode electrode was a carbon brush (GordonBrush Mfg. Co., Inc., Commerce, CA, USA), and the cathodeelectrode was a piece <strong>of</strong> carbon cloth (Zoltek Corporation, St.Louis, MO, USA) with a length <strong>of</strong> 4 cm and a width <strong>of</strong> 3 cm. Thecathode electrode was coated with Pt as a catalyst (0.5 mg Pt/cm 2 ) [8]. Both the anolyte and the <strong>catholyte</strong> were cont<strong>in</strong>uouslymixed by magnetic stirrers. An external voltage (0.8 V) wasapplied to the circuit by connect<strong>in</strong>g the negative pole <strong>of</strong> apower supply (3644 A, Circuit Specialists, Inc., Mesa, AZ, USA)Fig. 1 e Current generation <strong>in</strong> the MEC with different <strong>catholyte</strong>s: (A) 100, 50, 25 and 10 mM PBS; (B) 134, 100 and 200 mMNaCl; (C) DI and tap water; and (D) acidified water at pH 4 and pH 2 adjusted by H 2 SO 4 or HCl.
<strong>in</strong>ternational journal <strong>of</strong> hydrogen energy 38 (2013) 9619e9624 9621Table 1 e Coulombic efficiencies and hydrogen <strong>production</strong> <strong>in</strong> the MEC with different <strong>catholyte</strong>s.Catholytes Time period (day) Coulombicrecovery: CR (%)Cathodic H 2recovery: R cat (%)Overall H 2recovery: R H2 (%)H 2 <strong>production</strong>rate: Q H2 (m 3 H 2 /m 3 /d)100 mM PBS 1.44 0.10 34.6 1.0 89.2 9.2 30.8 2.3 0.237 0.03150 mM PBS 1.06 0.06 18.7 2.0 89.2 6.6 16.7 1.4 0.165 0.00525 mM PBS 1.11 0.07 13.2 0.4 80.1 3.7 10.6 0.8 0.100 0.00710 mM PBS 1.29 0.07 8.0 0.5 69.9 8.1 5.6 0.3 0.048 0.007134 mM NaCl 2.01 0.12 26.5 1.5 120.4 4.4 31.8 1.2 0.171 0.012100 mM NaCl 1.55 0.06 19.8 1.4 91.2 3.4 18.0 0.8 0.116 0.004200 mM NaCl 1.30 0.07 19.7 3.5 93.7 5.0 18.4 2.8 0.143 0.009DI water 5.10 1.47 42.8 6.8 67.9 12.6 28.5 1.4 0.065 0.021Tap water 3.14 0.61 10.9 2.6 93.8 22.1 9.8 0.1 0.034 0.007Acidified water (pH 4) a 2.81 0.18 11.0 2.1 156.3 17.3 17.0 1.3 0.065 0.002Acidified water (pH 2) a 1.19 0.05 21.5 0.8 84.7 1.8 18.2 0.5 0.171 0.004Acidified water (pH 2) b 1.37 0.07 18.5 2.0 65.5 8.4 12.0 0.8 0.089 0.002a Adjusted by sulfuric acid.b Adjusted by hydrochloric acid.to an external resistor (10 U), then to the cathode electrode,and the positive pole to the anode electrode.The MEC was operated <strong>in</strong> a fed-batch mode at 20 C. Theanode chamber was <strong>in</strong>oculated us<strong>in</strong>g anaerobic sludge fromSouth Shore Water Reclamation Facility (Milwaukee, WI,USA). The anode feed<strong>in</strong>g solution was prepared <strong>in</strong> tap waterconsist<strong>in</strong>g <strong>of</strong> 1.0 g/L sodium acetate, 0.3 g/L NH 4 Cl, 1.0 g/LNaCl, 0.03 g/L MgSO 4 , 0.04 g/L CaCl 2 , 0.2 g/L NaHCO 3 , 5.3 g/LKH 2 PO 4 , 10.7 g/L K 2 HPO 4 and 1 mL/L trace elements [8]. Fourgroups <strong>of</strong> <strong>catholyte</strong>s were exam<strong>in</strong>ed <strong>in</strong> the MEC: PBS, NaClsolution, water, and acidified water. The PBS was tested <strong>in</strong>four concentrations, 10, 25, 50, and 100 mM. The NaCl solutionwas prepared by dissolv<strong>in</strong>g NaCl <strong>in</strong> tap water to 100, 134, and200 mM. Two waters, tap water and deionized (DI) water, werestudied. The acidified water was prepared <strong>in</strong> two pHs, 2 and 4,us<strong>in</strong>g hydrochloric acid (HCl) or sulfuric acid (H 2 SO 4 ). The<strong>catholyte</strong> was completely replaced when the voltage droppedbelow 2 mV. The new <strong>catholyte</strong> was flushed with nitrogen gasfor 15 m<strong>in</strong> to remove any oxygen before start<strong>in</strong>g MEC operation.The anolyte was replaced by 80% with a fresh anodefeed<strong>in</strong>g solution at the same time when the <strong>catholyte</strong> wasreplaced. Dur<strong>in</strong>g the extended-<strong>catholyte</strong> study, the anolytewas replaced when the voltage decreased below 2 mV, but the<strong>catholyte</strong> was not replenished.2.2. Measurement and analysisThe voltage was monitored and recorded every 5 m<strong>in</strong> by adigital multimeter (Keithley Instruments Co., Ltd., USA). Theconcentration <strong>of</strong> chemical oxygen demand (COD) wasanalyzed by a DR/890 colorimeter (HACH Co., Ltd., USA). ThepH was measured us<strong>in</strong>g a bench-top pH meter (Oakton InstrumentsCo., Ltd., USA) and the electrical conductivity wasmeasured by a bench-top conductivity meter (Mettler-ToledoCo., Ltd., USA). The <strong>production</strong> <strong>of</strong> hydrogen gas was measuredby water replacement and analyzed by us<strong>in</strong>g a gasTable 2 e COD removal <strong>in</strong> anolyte and characteristics <strong>of</strong> effluent <strong>catholyte</strong> with different <strong>catholyte</strong>s.Catholytes COD removal (%) COD removal rate Effluent pHConductivity (ms/cm)(g COD/m 3 /d)InitialEffluent100 mM PBS 94.6 0.3 0.54 0.04 9.2 0.2 13.97 0.01 12.15 0.2350 mM PBS 97.0 0.4 0.69 0.07 8.9 0.2 8.52 0.80 9.67 0.3525 mM PBS 97.5 0.4 0.66 0.06 10.8 0.2 4.06 0.04 5.40 0.3010 mM PBS 97.2 0.4 0.59 0.05 11.3 0.2 1.44 0.48 2.63 0.57134 mM NaCl 96.7 0.7 0.37 0.03 12.2 0.1 13.88 0.24 21.07 0.65100 mM NaCl 95.9 1.8 0.44 0.02 12.0 0.1 7.68 0.66 15.28 0.92200 mM NaCl 96.7 0.2 0.54 0.05 11.9 0.1 20.00 0.20 25.05 0.30DI water 94.6 2.3 0.15 0.04 12.6 0.1 0.01 0.00 1.56 0.08Tap water 86.6 0.8 0.24 0.05 11.6 0.4 0.30 0.02 2.53 0.50Acidified water (pH 4) a 97.4 0.1 0.27 0.01 11.9 0.4 0.05 0.01 2.94 0.38Acidified water (pH 2) a 98.2 0.3 0.66 0.02 9.0 0.7 7.37 0.05 3.61 0.25Acidified water (pH 2) b 96.8 0.2 0.51 0.03 11.0 0.4 5.46 0.02 3.27 0.49a Adjusted by sulfuric acid.b Adjusted by hydrochloric acid.