Assignment 7: Capacity and Delay Problem 1
Assignment 7: Capacity and Delay Problem 1
Assignment 7: Capacity and Delay Problem 1

You also want an ePaper? Increase the reach of your titles
YUMPU automatically turns print PDFs into web optimized ePapers that Google loves.
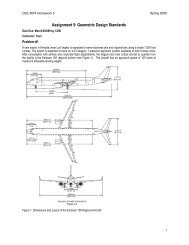
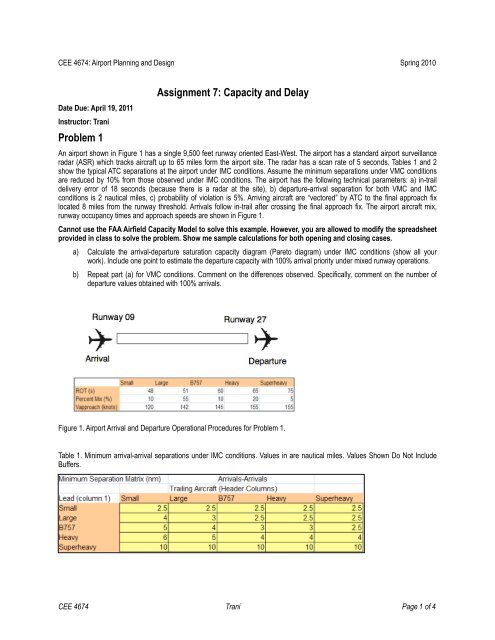
CEE 4674: Airport Planning <strong>and</strong> Design Spring 2010Date Due: April 19, 2011Instructor: Trani<strong>Problem</strong> 1<strong>Assignment</strong> 7: <strong>Capacity</strong> <strong>and</strong> <strong>Delay</strong>An airport shown in Figure 1 has a single 9,500 feet runway oriented East-West. The airport has a st<strong>and</strong>ard airport surveillanceradar (ASR) which tracks aircraft up to 65 miles form the airport site. The radar has a scan rate of 5 seconds. Tables 1 <strong>and</strong> 2show the typical ATC separations at the airport under IMC conditions. Assume the minimum separations under VMC conditionsare reduced by 10% from those observed under IMC conditions. The airport has the following technical parameters: a) in-traildelivery error of 18 seconds (because there is a radar at the site), b) departure-arrival separation for both VMC <strong>and</strong> IMCconditions is 2 nautical miles, c) probability of violation is 5%. Arriving aircraft are “vectored” by ATC to the final approach fixlocated 8 miles from the runway threshold. Arrivals follow in-trail after crossing the final approach fix. The airport aircraft mix,runway occupancy times <strong>and</strong> approach speeds are shown in Figure 1.Cannot use the FAA Airfield <strong>Capacity</strong> Model to solve this example. However, you are allowed to modify the spreadsheetprovided in class to solve the problem. Show me sample calculations for both opening <strong>and</strong> closing cases.a) Calculate the arrival-departure saturation capacity diagram (Pareto diagram) under IMC conditions (show all yourwork). Include one point to estimate the departure capacity with 100% arrival priority under mixed runway operations.b) Repeat part (a) for VMC conditions. Comment on the differences observed. Specifically, comment on the number ofdeparture values obtained with 100% arrivals.Figure 1. Airport Arrival <strong>and</strong> Departure Operational Procedures for <strong>Problem</strong> 1.Table 1. Minimum arrival-arrival separations under IMC conditions. Values in are nautical miles. Values Shown Do Not IncludeBuffers.CEE 4674 Trani Page 1 of 4
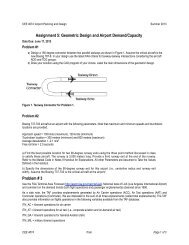
<strong>Problem</strong> 3The airport shown in Figure 3 is now the subject of saturation capacity analysis. The airport has an aircraft population mix similarto that of <strong>Problem</strong> 1. All other technical parameters are assumed to be the same (separations, speeds, ROT values, etc.) as thebaseline case defined in <strong>Problem</strong> 1.Figure 2. Diagram for Airport of <strong>Problem</strong> 2.A few operational rules apply to this airport:1) Aircraft taking off on runway 04L take 24 seconds to cross the runway intersection point.2) Aircraft taking off on runway 09 take 21 seconds to cross the runway intersection point.3) Takeoffs on 04L are allowed as long as an arrival on 09 is >=2.0 nm from the threshold 09.4) Takeoffs on 09 are allowed as long as an arrival on 09 is >=2.0 nm from the threshold 09.5) Takeoffs on 09 or 04L are allowed as soon as another takeoff has crossed the runway intersection (no wake vortex effect asthe aircraft are on the ground).6) Takeoffs on 04L are allowed as soon as an arrival on 09 has crossed the runway intersection (no wake vortex effect as theaircraft are on or very close to the ground).7) Arrivals on 09 <strong>and</strong> 04R are assumed to be independent.CEE 4674 Trani Page 3 of 4
Questions to be answered in your analysis.Cannot use the FAA Airfield <strong>Capacity</strong> Model to solve this example. However, you are allowed to modify the spreadsheetprovided in class to solve the problem. Show me sample calculations used in the analysis.a) Using the time-space analysis described in class <strong>and</strong> combining the analysis of various runways, estimate the IMCsaturation capacity diagram (Pareto) for the complete runway system. Show all your work.b) Assume that ATC controllers segregate arrival traffic <strong>and</strong> limit arrivals of super-heavies <strong>and</strong> heavies to runway 09 (pluslarge aircraft as needed to reach saturation arrival conditions). How could this help improve the overall saturationcapacity of the airport? Do the calculations <strong>and</strong> show the two Pareto diagrams in the same plot. Comment on theimprovements in capacity.c) Explain a scenario under which arrivals on runways 09 <strong>and</strong> 04R would not be independent. Answer this without movingthe runways closer together.<strong>Problem</strong> 4a) Calculate the IMC saturation capacity of the airport described in <strong>Problem</strong> 1 using the FAA Airfield <strong>Capacity</strong> Model provided inclass. Simplify the aircraft mix to 4 groups by taking the expected value of all heavy <strong>and</strong> super-heavy technical parameters <strong>and</strong>combining them into one group.b) Calculate the IMC saturation capacity of the airport described in <strong>Problem</strong> 3 (Part a) using the FAA Airfield <strong>Capacity</strong> Modelprovided in class. Simplify the aircraft mix to 4 groups by taking the expected value of all heavy <strong>and</strong> super-heavy technicalparameters <strong>and</strong> combining them into one group.CEE 4674 Trani Page 4 of 4