Assignment 5: Geometric Design and Airport Demand/Capacity ...
Assignment 5: Geometric Design and Airport Demand/Capacity ...
Assignment 5: Geometric Design and Airport Demand/Capacity ...

Create successful ePaper yourself
Turn your PDF publications into a flip-book with our unique Google optimized e-Paper software.
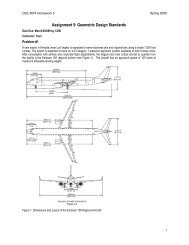
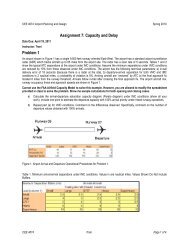
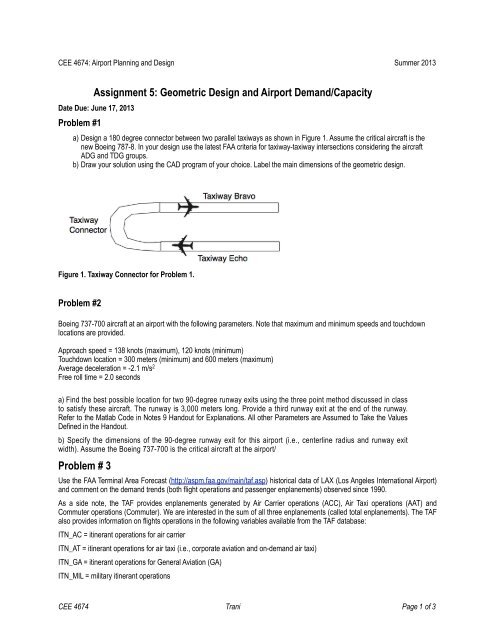
CEE 4674: <strong>Airport</strong> Planning <strong>and</strong> <strong>Design</strong> Summer 2013<strong>Assignment</strong> 5: <strong>Geometric</strong> <strong>Design</strong> <strong>and</strong> <strong>Airport</strong> Dem<strong>and</strong>/<strong>Capacity</strong>Date Due: June 17, 2013Problem #1a) <strong>Design</strong> a 180 degree connector between two parallel taxiways as shown in Figure 1. Assume the critical aircraft is thenew Boeing 787-8. In your design use the latest FAA criteria for taxiway-taxiway intersections considering the aircraftADG <strong>and</strong> TDG groups.b) Draw your solution using the CAD program of your choice. Label the main dimensions of the geometric design.Figure 1. Taxiway Connector for Problem 1.Problem #2Boeing 737-700 aircraft at an airport with the following parameters. Note that maximum <strong>and</strong> minimum speeds <strong>and</strong> touchdownlocations are provided.Approach speed = 138 knots (maximum), 120 knots (minimum)Touchdown location = 300 meters (minimum) <strong>and</strong> 600 meters (maximum)Average deceleration = -2.1 m/s 2Free roll time = 2.0 secondsa) Find the best possible location for two 90-degree runway exits using the three point method discussed in classto satisfy these aircraft. The runway is 3,000 meters long. Provide a third runway exit at the end of the runway.Refer to the Matlab Code in Notes 9 H<strong>and</strong>out for Explanations. All other Parameters are Assumed to Take the ValuesDefined in the H<strong>and</strong>out.b) Specify the dimensions of the 90-degree runway exit for this airport (i.e., centerline radius <strong>and</strong> runway exitwidth). Assume the Boeing 737-700 is the critical aircraft at the airport/Problem # 3Use the FAA Terminal Area Forecast (http://aspm.faa.gov/main/taf.asp) historical data of LAX (Los Angeles International <strong>Airport</strong>)<strong>and</strong> comment on the dem<strong>and</strong> trends (both flight operations <strong>and</strong> passenger enplanements) observed since 1990.As a side note, the TAF provides enplanements generated by Air Carrier operations (ACC), Air Taxi operations (AAT) <strong>and</strong>Commuter operations (Commuter). We are interested in the sum of all three enplanements (called total enplanements). The TAFalso provides information on flights operations in the following variables available from the TAF database:ITN_AC = itinerant operations for air carrierITN_AT = itinerant operations for air taxi (i.e., corporate aviation <strong>and</strong> on-dem<strong>and</strong> air taxi)ITN_GA = itinerant operations for General Aviation (GA)ITN_MIL = military itinerant operationsCEE 4674 Trani Page 1 of 3
LOC_GA = local GA operationsLOC_MIL = local military operationsAn itinerant operation is one that starts at an airport <strong>and</strong> ends at another airport. A local operation starts at one airport <strong>and</strong> endsat the same airport. For each airport do the following:a) Plot the historical number of total enplanements as a function of time.c) Comment on the trends observed for flight operations <strong>and</strong> passenger enplanements. What happened in the years 2001 <strong>and</strong> in2008 to cause the observed dem<strong>and</strong> shifts?Problem # 4Historical passenger enplanement data for the Punta Cana <strong>Airport</strong> is shown in the following table. An Excel file is also availablewith the data.Table 1. PUJ Passenger Dem<strong>and</strong>.Year Arriving Passengers Departing Passengers1,984 2,976 2,9761,985 6,951 6,9511,986 9,438 9,4381,987 11,925 11,9251,988 30,236 30,2361,989 50,733 50,7331,990 71,231 71,2311,991 69,924 69,9241,992 108,538 108,5381,993 164,717 164,7171,994 226,716 226,7161,995 343,135 343,1351,996 395,096 388,7811,997 460,134 448,5831,998 522,609 515,7271,999 657,392 651,5642,000 888,847 878,6862,001 921,448 927,3852,002 962,679 949,8252,003 1,292,089 1,286,103CEE 4674 Trani Page 2 of 3
Year Arriving Passengers Departing Passengers2,004 1,357,950 1,352,9172,005 1,481,203 1,470,1522,006 1,727,169 1,711,6712,007 1,789,274 1,785,4472,008 1,858,563 1,851,8542,009 1,901,646 1,894,2922,010 2,006,426 1,997,7072,011 2,229,607 2,225,657a) Plot the enplanements (passengers leaving the airport) as a function of time.b) Perform a simple logistic regression model (see example ion page 30 of notes 11 - week 8) to forecast the future dem<strong>and</strong>at the airport with limited capacity constraints. One estimate of the maximum number of passenger enplanements withthe current airport infrastructure is 3.5 million passengers annually. Estimate the best values of coefficients a <strong>and</strong> b in thelogistic regression model.CEE 4674 Trani Page 3 of 3