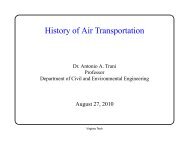
Detailed Example of Aircraft Performance Calculations: Climb ...
Detailed Example of Aircraft Performance Calculations: Climb ...
Detailed Example of Aircraft Performance Calculations: Climb ...

You also want an ePaper? Increase the reach of your titles
YUMPU automatically turns print PDFs into web optimized ePapers that Google loves.
<strong>Example</strong> - <strong>Aircraft</strong> <strong>Climb</strong> <strong>Performance</strong>Controlling the Speed Pr<strong>of</strong>ile• Very large capacity transport aircraft (http://128.173.204.63/courses/cee5614/cee5614_pub/AirbusA380_class.m)• The aircraft speed is controlled by the last three lines <strong>of</strong> data inthe aircraft data file• Line 1 (see below) defines the climb speed in knots (indicatedairspeed)• Line 2 defines the descent speed in knots (IAS)• Line 3 defines the altitudes at which each speed value is selected• For example: The aircraft below climbs at 210 knots just aftertake<strong>of</strong>f (zero altitude) and reaches 250 knots at 4000 metersVirginia Tech - Air Transportation Systems Laboratory4
<strong>Example</strong> - Very Large Capacity <strong>Aircraft</strong>Data File• An aircraft similar in size and performance as the Airbus A380• Four turb<strong>of</strong>an engines each developing 34,400 kg (338,000 N)at sea level• Maximum take<strong>of</strong>f mass is 540,000 kg. (1.188 million pounds)Airbus A380 taxies to the gate at LAX (A.A. Trani)Virginia Tech - Air Transportation Systems Laboratory5
Calculation Procedure• Step 1: Estimate true airspeed using atmospheric model• Step 2: Estimate the lift coefficient needed to sustain flightusing the basic lift equation• Step 3: Estimate drag coefficient• Step 4: Estimate total drag (D)• Step 5: Estimate the thrust produced by the engines at altitude(T)• Step 6: Find the rate <strong>of</strong> climb (dh/dt)Virginia Tech - Air Transportation Systems Laboratory8
<strong>Aircraft</strong> <strong>Climb</strong> <strong>Performance</strong>2,000 feet and 210 knots IAS• Using the standard expression to estimate the true machnumber <strong>of</strong> the aircraft at altitude,⎡⎧⎪M true= 5⎢⎢⎨⎣⎢⎩⎪ρ 0ρ⎛ ⎡ ⎛⎢1+ 0.2⎝⎜⎝⎜ ⎣V IAS661.52⎞⎠⎟⎤⎥⎦3.5⎞ ⎫−1⎠⎟ +1 ⎪⎬⎭⎪0.286⎤−1⎥⎥⎦⎥• The true mach number is 0.3267, the speed <strong>of</strong> sound at 600meters is 337.96 m/s and the density <strong>of</strong> air is 1.156 k/cu. m.• The true airspeed (TAS) is 110.41 m/s or 214.6 knots• Use the fundamental lift equation to estimate the lift coefficientunder the known flight conditionL = mg = 1 2 ρV 2 SC lVirginia Tech - Air Transportation Systems LaboratoryC l= 2mgρV 2 S9
<strong>Aircraft</strong> <strong>Climb</strong> <strong>Performance</strong>2,000 feet and 210 knots IAS• The lift coefficient needed to maintain flight is,C l= 2mgρV 2 S = 2 * (540,000)(9.81)(1.1560)(110.42) 2 (858)• The lift coefficient is non-dimensional• The drag coefficient can be calculated using the standardparabolic drag polar modelC d= C do+ C di= C do+(kg)(m / s 2 )(kg / m 3 )(m / s)(m 2 ) = 0.8761C 2lπ ARe = 0.020 + 0.8761 2π(9.0)(0.84) = 0.0523 10• Note that the value <strong>of</strong> Cdo is found by interpolation in the tablefunction relating Cdo and Mach number (Cd is non-dimensional)Virginia Tech - Air Transportation Systems Laboratory
<strong>Aircraft</strong> <strong>Climb</strong> <strong>Performance</strong>2,000 feet and 210 knots IAS• The total drag is,D = 1 2 ρV 2 SC d= 1 2 (1.156)(110.42)2 (858)(0.0523) = 316,340N• The calculated drag has units <strong>of</strong> Newtons (verify by yourself)• The thrust produced by all 4 engines in the very large capacitytransport is estimated using the simple linear modelT 0,M= T 0,M =0− λM trueT h,M= T 0,M⎛ ρ h⎝⎜ ρ 0⎞⎠⎟m• The first expression estimates the thrust at sea level (hencesubscript 0) at any mach number• The second expression corrects the thrust developed for any altitude(h)Virginia Tech - Air Transportation Systems Laboratory11
Definition <strong>of</strong> Terms to Estimate Engine ThrustT 0,M= Thrust at sea level and at Mach number M (Newtons)T 0,M =0= Thrust at sea level and at Mach = 0 (zero speed) (Newons)λ = Rate <strong>of</strong> change <strong>of</strong> thrust vs. Mach number (lapse rate) (Newton/Mach)M true= True mach number (dimensionless)T h,M= Thrust at altitude h and Mach number Mρ h= Air density at altitude h (kg/m 3 )ρ o= Air density at sea level (zero altitude) (kg/m 3 )m = Thrust lapse rate (dimensionless)Virginia Tech - Air Transportation Systems Laboratory12
A Simple <strong>Aircraft</strong> Model for Engine Thrust• The following picture provides a visual effect <strong>of</strong> the thrust modelThrustT0,M=0-λT0,MT 0,M= T 0,M =0− λM trueT h,M= T 0,M⎛ ρ h⎝⎜ ρ 0⎞⎠⎟mTh,MThrust line at sea levelThrust line at altitudeMach Number (Mtrue)Virginia Tech - Air Transportation Systems Laboratory13
<strong>Aircraft</strong> <strong>Climb</strong> <strong>Performance</strong>2,000 feet and 210 knots IAS• The thrust developed by each engine is a linear function <strong>of</strong> machnumber. At sea level and Mach 0.3267 the thrust is,T 0,M= T 0,M =0− λM trueT 0,M= 338,000 − 175,560M trueT 0,M= 338,000 − 175,560(0.3267)T 0,M= 280,646 Newtons• The thrust at altitude (h) is then,T h,M= T 0,M⎛ ρ h⎝⎜ ρ 0T•h,M= 265, 450 Newtons⎞⎠⎟T h,M= 280,646 1.1560.96⎛ ⎞⎝⎜1.225⎠⎟mVirginia Tech - Air Transportation Systems Laboratory14
<strong>Aircraft</strong> <strong>Climb</strong> <strong>Performance</strong>2,000 feet and 210 knots IAS• The thrust developed by each engine has been calculated atthe prescribed Mach number (0.3267) and climb speed (214.6knots)• The aircraft has four engines so the total thrust for the climbcondition is,T total= T h,Mnwheren is the number <strong>of</strong> engineT h,Mis the thrust at altitude and Mach numberT total= 265,450(4) = 1,061,800 Newtons• This is the total thrust developed by four engines at 210 knotsand 600 meters above sea level under ISA conditionsVirginia Tech - Air Transportation Systems Laboratory15
<strong>Aircraft</strong> <strong>Climb</strong> <strong>Performance</strong>2,000 feet and 210 knots IAS• The rate <strong>of</strong> climb <strong>of</strong> the aircraft can be calculated,dhdt = (T total− D)Vmgdhdtdh==(1,061,800 − 316,340)110.42540,000(9.81)(N − N)kg(m / s 2 )dt = 15.53 m / s 16• This is equivalent to 932.3 meters per minute or 3,058 feet perminute• This climb rate is typical <strong>of</strong> transport aircraft at low altitudes• The process is now repeated for state 2Virginia Tech - Air Transportation Systems Laboratory
<strong>Aircraft</strong> <strong>Climb</strong> <strong>Performance</strong>8000 m (26,200 feet) and 290 knots IAS• The true mach number is 0.6512, the speed <strong>of</strong> sound is 308.0 m/s and the density <strong>of</strong> air is 0.524 k/cu. m.• The true airspeed (TAS) is 200.8 m/s or 390 knots•The lift coefficient needed to maintain flight at 200.63 m/s is,C l= 2mgρV 2 S = 2 *(540,000)(9.81)(0.524)(200.8) 2 (858)• The drag coefficient at 26,200 feet and 290 knots (IAS) can becalculated using the standard parabolic drag polar modelC d= C do+ C di= C do+• Note that the value <strong>of</strong> C do at Mach 0.6512 is 0.020Virginia Tech - Air Transportation Systems Laboratory(kg)(m / s 2 )(kg / m 3 )(m / s)(m 2 ) = 0.5844C 2lπ ARe = 0.020 + 0.5844 2π(9.0)(0.84) = 0.0344 17
<strong>Aircraft</strong> <strong>Climb</strong> <strong>Performance</strong>8000 m (26,200 feet) and 290 knots IAS• The total drag is,D = 1 2 ρV 2 SC d= 1 2 (0.524)(200.8)2 (858)(0.0344) = 311,800N• The thrust produced by all 4 engines in the very large capacitytransport is estimated to be:• The thrust developed by each engine at Mach 0.6512 and 8,000meters is,T 0,M= T 0,M =0− λM trueT 0,M= 338,000 − 175,560M trueT 0,M= 338,000 − 175,560(0.6512)T 0,M= 235,110 Newtons• Now correct for altitudeVirginia Tech - Air Transportation Systems Laboratory18
<strong>Aircraft</strong> <strong>Climb</strong> <strong>Performance</strong>8000 m (26,200 feet) and 290 knots IAS• The thrust at altitude (h) is then,m⎛ ρT h,M= T h⎞0,M⎝⎜ ρ 0 ⎠⎟T h,M= 235,110 0.5240.96⎛ ⎞⎝⎜1.225 ⎠⎟T h,M= 104,040 Newtons• For four engines the total thrust is,T total= T h,MnT total= 104,040(4) = 416,180 Newtons• Now we can calculate the rate <strong>of</strong> climb at Mach 0.6512 and8,000 metersVirginia Tech - Air Transportation Systems Laboratory19
<strong>Aircraft</strong> <strong>Climb</strong> <strong>Performance</strong>8000 m (26,200 feet) and 290 knots IAS• The rate <strong>of</strong> climb <strong>of</strong> the aircraft can be calculated,• This is equivalent to 237 meters per minute or 779 feetper minute• The rate <strong>of</strong> climb has ben reduced to about ~1/4compared to near sea level conditionsVirginia Tech - Air Transportation Systems Laboratory20
<strong>Aircraft</strong> <strong>Climb</strong> <strong>Performance</strong>Calculation <strong>of</strong> Lift-to-Drag Ratio• The lift-to-drag ratio is calculated a the ratio <strong>of</strong> Cl andCd,• At h=600 meters and 210 knots (IAS)L / D = C lC d= 0.87610.0523 = 16.7• At h=8,000 meters and 290 knotsL / D = C lC d= 0.54880.0344 = 16.9• The lift-to-drag ratio is a key parameter in thedetermination <strong>of</strong> range <strong>of</strong> the aircraftVirginia Tech - Air Transportation Systems Laboratory21
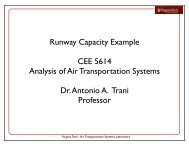
Rate Of <strong>Climb</strong> Analysis• Repeating the steps shown the previous pages wecan estimate the rate <strong>of</strong> climb for the complete climbpr<strong>of</strong>ile (i.e., multiple altitudes)210 knots220 knots230 knots250 knotsIndicated Airspeeds (IAS)used in the climb pr<strong>of</strong>ile260 knots290 knotsVirginia Tech - Air Transportation Systems Laboratory22
Observations• Rate <strong>of</strong> climb is high at low altitudes (due to highthrust available)• The rate <strong>of</strong> climb decreases non-linearly with altitude(lower atmospheric density reduces engine thrust)• The rate <strong>of</strong> climb is affected by other environmentaland operational variables:• <strong>Aircraft</strong> weight• Temperature• <strong>Climb</strong> speedVirginia Tech - Air Transportation Systems Laboratory23
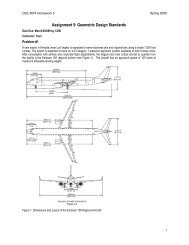
Sensitivity AnalysisRate <strong>of</strong> <strong>Climb</strong> vs. Weight• Varying the weight <strong>of</strong> the aircraft from 540,000kg to 450,000 kgVirginia Tech - Air Transportation Systems Laboratory24
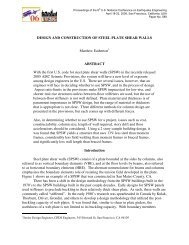
Sensitivity AnalysisRate <strong>of</strong> <strong>Climb</strong> vs. Temperature• Varying the temperature <strong>of</strong> the atmospherefrom ISA to ISA + 30 degrees CelsiusVirginia Tech - Air Transportation Systems Laboratory25
Implications for Real-world AviationOperations• The performance <strong>of</strong> the aircraft has pr<strong>of</strong>oundeffects in real-world flight planning applications• Obstacle accountability analysis• Obstacle clearance procedures in theterminal area (after take<strong>of</strong>f)• Obstacle clearance in engine outconditions• Limits on carrying passengers and carg<strong>of</strong>rom a challenging airport• Time to climb is affected and assignedcruise altitudeVirginia Tech - Air Transportation Systems Laboratory26
A Challenging Airport for Departure<strong>Performance</strong>• Eagle County Airport in Colorado (EGE)• 9000 x 150 foot runway• Obstacles due to terrain on both approach and departureprocedures• Airport elevation is 6,535 feet above mean sea level• Airport has commercial operations using high-performancetwin-engine aircraft (Boeing 757-200)Boeing 757-200 winglets departing LAX (A.A. Trani)Virginia Tech - Air Transportation Systems Laboratory27
Eagle County Airport (EGE)source: FAAVirginia Tech - Air Transportation Systems Laboratory28
Use <strong>of</strong> Airport Approach and DepartureAeronautical Charts• To illustrate some challenging airport operational proceduresrelated to aircraft climb performance we use some approach anddeparture aeronautical charts• These charts are used by pilots and ATC to plan and fly arrival anddeparture procedures (flight tracks) to the airport. These are calledStandard Terminal Arrival Routes (STAR), Standard InstrumentDepartures (SID), and Instrument Approach Procedures (IAP)• You can obtain airport STAR, SID and IAP charts at: http://flightaware.com/• More information on how to read these charts can be found:• http://www.naco.faa.gov/index.asp?xml=naco/online/aero_guide• http://sunairexpress.com/images/How_to_Read_Approach_Plates.pdfVirginia Tech - Air Transportation Systems Laboratory29
Departure Procedure from EGE(Runway 25)Note crossing altituderestriction at MELVL<strong>Climb</strong>ing left turnheading 215 degreesto avoid natural terrainto the West <strong>of</strong> theairportAirportRequires 815 feet/nm <strong>of</strong>climb performancesource: FAAVirginia Tech - Air Transportation Systems Laboratory30
RNAV Approach Procedure toEGE (Runway 25)Descent to the airportfrom NE avoids thehighest terrainRNAV waypointsprovide a complex trackMissed approach trackis a escape routethrough lower terrainAirportVertical pr<strong>of</strong>ile <strong>of</strong>approach tracksource: FAAVirginia Tech - Air Transportation Systems Laboratory31
Departure Procedure from EGE Airport (Runway 25)Departure TrackAirportsource: Google Earth (2009)Virginia Tech - Air Transportation Systems Laboratory32
Use <strong>of</strong> Matlab Code• The previous analysis has been done using theUnrestricted<strong>Climb</strong>Analysis.m program• This main file integrates numerically the equations <strong>of</strong> motion<strong>of</strong> the aircraft• Four state variables:• Altitude (y(1))• <strong>Aircraft</strong> weight (y(2))• Distance traveled along path (y(3))• Distance traveled along the plane <strong>of</strong> the earth (y(4))• The initial conditions <strong>of</strong> the states are specified in the fileunder line 54• yN = [h_TOD Mass_init 0 0]; % Vector <strong>of</strong> initial values <strong>of</strong> state variablesVirginia Tech - Air Transportation Systems Laboratory33
Unrestricted<strong>Climb</strong>Analysis.m• Main program to execute the descent analysis• Employs Matlab Ordinary Differential Equation solver (ODE15s)• Function Calls:• fclimb_06.m - function that contains the equations <strong>of</strong> motion<strong>of</strong> the aircraft in the descent phase• densityAltitude<strong>of</strong>fISA.m - function to estimate theatmospheric conditions for both ISA and non-ISA conditions• drag03.m - function to estimate the aircraft drag at any altitude(h) and Mach number (M)• thrust_calculation.m - fundtion to estimate the thrustproduced by the engine for any Mach number and altitude (h)conditionVirginia Tech - Air Transportation Systems Laboratory34
Unrestricted<strong>Climb</strong>Analysis.m• Inputs to the Program• <strong>Aircraft</strong> file to be used in analysis (line 36)• Speed pr<strong>of</strong>ile. <strong>Climb</strong> speed pr<strong>of</strong>ile specified as a table function inthe aircraft file (lines 29 and 31 in aircraft file)• Initial aircraft states (lines 38-42 in main program)• altitude, mass, distance traveled along path and distancetraveled along a flat earthVirginia Tech - Air Transportation Systems Laboratory35
Unrestricted<strong>Climb</strong>Analysis.m• Outputs <strong>of</strong> the Program• Results <strong>of</strong> the four aircraft state variables in the climb pr<strong>of</strong>ile(altitude, mass, distance traveled along path and distancealong flat earth)• Plots <strong>of</strong> state variables vs. time• Plot <strong>of</strong> state variables vs. distance flownVirginia Tech - Air Transportation Systems Laboratory36