3 Runway Capacity Example - Air Transportation Systems Laboratory
3 Runway Capacity Example - Air Transportation Systems Laboratory
3 Runway Capacity Example - Air Transportation Systems Laboratory

Create successful ePaper yourself
Turn your PDF publications into a flip-book with our unique Google optimized e-Paper software.
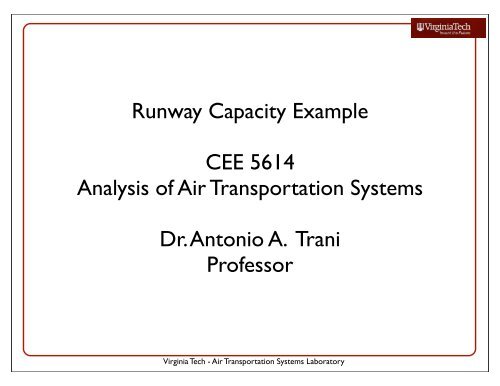
<strong>Runway</strong> <strong>Capacity</strong> <strong>Example</strong>CEE 5614Analysis of <strong>Air</strong> <strong>Transportation</strong> <strong>Systems</strong>Dr. Antonio A. TraniProfessorVirginia Tech - <strong>Air</strong> <strong>Transportation</strong> <strong>Systems</strong> <strong>Laboratory</strong>
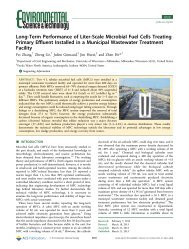
Problem Description• The airport to be studied in this problem is shown in Figure 1• The airport has two 9,000 foot runways with a configurationshown in the Figure 1• The airport has an airport surveillance radar (ASR) whichtracks aircraft up to 60 miles form the airport site• Tables 1 and 2 show the typical ATC separations at theairport under IMC conditions• Tables 3 and 4 show the separations under VMC conditions• The airport has the following technical parameters: a) in-traildelivery error of 16 seconds, b) departure-arrival separationfor both VMC and IMC conditions is 2 nautical miles, c)probability of violation is 5%• Arriving aircraft are “vectored” by ATC to the final approachfix (see Figure) located 7 miles from the runway thresholdVirginia Tech - <strong>Air</strong> <strong>Transportation</strong> <strong>Systems</strong> <strong>Laboratory</strong>2
Problem Description• The airport has an aircraft fleet mix made up of 10%small, 65% large and 25% heavy wake class aircraft• The characteristics of the aircraft are given in Table 5• Observed runway occupancy times in the field are: 48,55, and 62 seconds for small, large and heavy aircraft,respectively• Assume the 3-point runway deceleration calculationmethod applies to this problem to estimate the time tocross the intersectionVirginia Tech - <strong>Air</strong> <strong>Transportation</strong> <strong>Systems</strong> <strong>Laboratory</strong>3
Problem Description• In your analysis assume departing aircraft accelerate onthe runway at a constant rate of 2.2 m/s 2• Assume that ATC controllers release departures onrunway 18-36, around 10 seconds after an arrivingaircraft crosses the intersection between runways09L-27R and 18-36• Arrivals and departures are not airborne at theintersection• For departures on runway 18-36 to occur, it is desiredthat when the departing aircraft is released from thetakeoff position, the next arrival to runway 09L be noless than 2.0 nm from the arrival threshold• This rule is used by ATC controllers to scheduledepartures on runway 36Virginia Tech - <strong>Air</strong> <strong>Transportation</strong> <strong>Systems</strong> <strong>Laboratory</strong>4
Problem DescriptionVirginia Tech - <strong>Air</strong> <strong>Transportation</strong> <strong>Systems</strong> <strong>Laboratory</strong>5
Problem Description(IFR Separations)Table 1. Minimum arrival-arrival separations under IMC conditions. Values in are nautical miles.Table 2. Minimum departure-departure separations under IMC conditions. Values in are in seconds.Virginia Tech - <strong>Air</strong> <strong>Transportation</strong> <strong>Systems</strong> <strong>Laboratory</strong>6
Problem Description(VFR Separations)Table 3. Minimum arrival-arrival separations under VMC conditions. Values in are nautical miles.Table 4. Minimum departure-departure separations under IMC conditions. Values in are in seconds.Virginia Tech - <strong>Air</strong> <strong>Transportation</strong> <strong>Systems</strong> <strong>Laboratory</strong>7
Problem Description(<strong>Runway</strong> Performance)Table 5. <strong>Runway</strong> Performance Data.<strong>Air</strong>craft Group Parameters Representative <strong>Air</strong>craftSmall aircraftLarge aircraftHeavy aircraftApproach speed = 125 knotsTouchdown location = 1,200 feetAverage deceleration = -4.2 ft/s 2Free roll time = 2.0 seconds(after touchdown and beforebraking)Approach speed = 145 knotsTouchdown location = 1,300 feetAverage deceleration = -4.2 ft/s 2Free roll time = 2.0 secondsApproach speed = 155 knotsTouchdown location = 1,400 feetAverage deceleration = -4.2 ft/s 2Free roll time = 2.0 secondsCessna Citation 560, Citation500, Beechcraft Jet 400Boeing 737-400 (B-737-400),<strong>Air</strong>bus A320 (A-320-200)Boeing 747-400, <strong>Air</strong>busA340-600Virginia Tech - <strong>Air</strong> <strong>Transportation</strong> <strong>Systems</strong> <strong>Laboratory</strong>8
Questions1.Calculate the arrival-departure saturation capacitydiagram (Pareto diagram) under IMC conditions forthis airport2.Calculate the arrival-departure saturation capacitydiagram (Pareto diagram) under VMC conditions forthis airport•State all your assumptions in your calculationVirginia Tech - <strong>Air</strong> <strong>Transportation</strong> <strong>Systems</strong> <strong>Laboratory</strong>9
Solution to the Problem• Steps in the solution• Start with a single runway analysis for IMCconditions• Identify interactions between runways• Use the principle of superposition wheneverpossible (i.e., study independent runways andthen add their capacity)• Set-up a manual simulation scheme to look atvarious operational strategies for the airportVirginia Tech - <strong>Air</strong> <strong>Transportation</strong> <strong>Systems</strong> <strong>Laboratory</strong>10
Single <strong>Runway</strong> Analysis(Arrival Operations)• Use the spreadsheet program provided in class or yourown manual calculationsIFRConditionsArrivals-Only<strong>Capacity</strong>30.98 perhourVirginia Tech - <strong>Air</strong> <strong>Transportation</strong> <strong>Systems</strong> <strong>Laboratory</strong>11
Single <strong>Runway</strong> Analysis(departure operations)IFRConditionsDepartures-Only<strong>Capacity</strong>45.07 perhourVirginia Tech - <strong>Air</strong> <strong>Transportation</strong> <strong>Systems</strong> <strong>Laboratory</strong>12
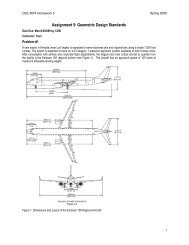
IFR <strong>Capacity</strong> Pareto Diagram(Single <strong>Runway</strong> Analysis)Saturation <strong>Capacity</strong> for a Single <strong>Runway</strong> at the <strong>Air</strong>portunder Various Operational Conditions. The diagram appliesto one runway (either 09L-27R or 09R-27L)(0,31)(8,31)(24,25)IFRConditions(45,0)Virginia Tech - <strong>Air</strong> <strong>Transportation</strong> <strong>Systems</strong> <strong>Laboratory</strong>13
IFR <strong>Capacity</strong> Pareto Diagram(Two Parallel and Independent <strong>Runway</strong>s)Saturation <strong>Capacity</strong> for two runways at the <strong>Air</strong>port underVarious Operational Conditions. The diagram applies toone runway (either 09L-27R or 09R-27L)(0,62)(16,62)(48,51)IFRConditions(90,0)Virginia Tech - <strong>Air</strong> <strong>Transportation</strong> <strong>Systems</strong> <strong>Laboratory</strong>14
VFR <strong>Capacity</strong> Pareto Diagram(Single <strong>Runway</strong> Analysis)Saturation <strong>Capacity</strong> for a Single <strong>Runway</strong> at the <strong>Air</strong>portunder Various Operational Conditions. The diagram appliesto one runway (either 09L-27R or 09R-27L)(0,35)(10,35)(25,26)VFRConditions(56,0)Virginia Tech - <strong>Air</strong> <strong>Transportation</strong> <strong>Systems</strong> <strong>Laboratory</strong>15
VFR <strong>Capacity</strong> Pareto Diagram(Two Parallel and Independent <strong>Runway</strong>s)Saturation <strong>Capacity</strong> for a Single <strong>Runway</strong> at the <strong>Air</strong>portunder Various Operational Conditions. The diagram appliesto one runway (either 09L-27R or 09R-27L)(0,70)(20,70)(50,52)VFRConditions(112,0)Virginia Tech - <strong>Air</strong> <strong>Transportation</strong> <strong>Systems</strong> <strong>Laboratory</strong>16
Observations• Arrivals on runways 09L and 09R areindependent (> 4300 ft separation) (radaravailable)• The Pareto diagram found for one runwayreplicates for the second parallel runway (alsoused in mixed operations mode)• The arrivals-only saturation capacity of thetwo-runway system is 62 per hour• The departures-only saturation capacity fortwo parallel runways is 90 per hourVirginia Tech - <strong>Air</strong> <strong>Transportation</strong> <strong>Systems</strong> <strong>Laboratory</strong>17
Detailed Analysis for Intersecting<strong>Runway</strong>s• The intersecting runway is treated as anotherasset at the airport• Need to answer the fundamental questions:• Are there any gaps left by successive arrivals(do nothing) allowing departures from runway36?• Quantify the capacity benefit for IFRconditionsVirginia Tech - <strong>Air</strong> <strong>Transportation</strong> <strong>Systems</strong> <strong>Laboratory</strong>18
Approach• Visualize the situation by drawing variousoperations• Determine the added number of departures onrunway 36 allowed with the “natural” arrivalgaps on runway 09L• Assume that departures on runway 09L arenot processed since runway 36 offers clearadvantages• The diagrams that follow illustrate varioussteps in the sequence of events likely tohappen at the airport as “closing” case,pairwise arrival sequencesVirginia Tech - <strong>Air</strong> <strong>Transportation</strong> <strong>Systems</strong> <strong>Laboratory</strong>19
<strong>Air</strong>craft Positions at Time t = 0 sminimum separation+ bufferδ ij+B ij3600 V jV jin knotsB ijin secondsVirginia Tech - <strong>Air</strong> <strong>Transportation</strong> <strong>Systems</strong> <strong>Laboratory</strong><strong>Air</strong>craft 1 crosses runway 09Lthreshold . <strong>Air</strong>craft 3 follows intrailat the required separationbehind aircraft 120
Calculations of Travel Time for Landing<strong>Air</strong>craft to Cross <strong>Runway</strong> Intersection• Calculation of the travel times from thresholdcrossing point to runway intersection point• The travel times to cross the intersection ofrunway 18-36 (as the aircraft lands on runway09L) are: 5.8, 5.0 and 4.6 seconds for small,large and heavy aircraft, respectively• These travel times influence the ATC towercontroller (i.e. local controller) decision onwhen to clear a departure on the crossingrunwayVirginia Tech - <strong>Air</strong> <strong>Transportation</strong> <strong>Systems</strong> <strong>Laboratory</strong>21
Calculations of Travel Time to Cross<strong>Runway</strong> Intersection for Departing<strong>Air</strong>craft on <strong>Runway</strong> 36S = V it + 1 2 at 2t 2 = 2Sat =2Sa<strong>Air</strong>craft departingrunway 36 take ~23seconds to cross therunway intersectiont =2Sa=2(555.6 m)2.2 m/s 2 = 22.5 secondsVirginia Tech - <strong>Air</strong> <strong>Transportation</strong> <strong>Systems</strong> <strong>Laboratory</strong>22
<strong>Air</strong>craft Positions at Time t=6 s<strong>Air</strong>craft Positionsat time = 6 seconds<strong>Air</strong>craft 3<strong>Runway</strong> 09LB ijδ ij+3600 V j− 63600 (V j)where:B ijis the buffer time in secondsV jis the following aircraft speedin knots<strong>Runway</strong> 36<strong>Air</strong>craft 1 <strong>Runway</strong> 27Rcrosses therunway intersection<strong>Air</strong>craft 2Virginia Tech - <strong>Air</strong> <strong>Transportation</strong> <strong>Systems</strong> <strong>Laboratory</strong>23
<strong>Air</strong>craft Positions at Time t=16 s<strong>Runway</strong> 36<strong>Air</strong>craft 2 starts its takeoff roll10 seconds after aircraft 1 clearsthe intersection (this accountsfor ATC situational awareness)<strong>Air</strong>craft Positionsat time = 16 seconds<strong>Air</strong>craft 3<strong>Runway</strong> 09L<strong>Air</strong>craft 1<strong>Runway</strong> 27RB ijδ ij+3600 V − 16j3600 (V ) jwhere:B ijin secondsV jin knots<strong>Air</strong>craft 2starts its takeoffrollVirginia Tech - <strong>Air</strong> <strong>Transportation</strong> <strong>Systems</strong> <strong>Laboratory</strong>24
<strong>Air</strong>craft Positions at Time t = 39 s<strong>Air</strong>craft 2 just crossed the runwayintersection after a takeoff roll of23 seconds to reach theintersection point<strong>Air</strong>craft Positionsat time = 39seconds<strong>Air</strong>craft 3<strong>Runway</strong> 09L<strong>Air</strong>craft 2<strong>Air</strong>craft 1<strong>Runway</strong> 27RB ijδ ij+3600 V − 39j3600 (V ) jwhere:B ijin secondsV jin knots<strong>Runway</strong> 36Virginia Tech - <strong>Air</strong> <strong>Transportation</strong> <strong>Systems</strong> <strong>Laboratory</strong>25
Critical Distance at t = 39 sAt t=39 seconds, the distancefrom runway threshold 09L toaircraft 3 has to be equal or greaterthan 2.0 nm<strong>Air</strong>craft Positionsat time = 39seconds<strong>Air</strong>craft 3<strong>Runway</strong> 09L<strong>Air</strong>craft 2<strong>Air</strong>craft 1<strong>Runway</strong> 27Rδ = 2.5 nm = δ ij+B ij3600 V − 39j3600 (V ) jδ ij+B ij3600 V j− 393600 V j≥ 2.0 nm<strong>Runway</strong> 36Condition to release a departure betweenarrival gapsVirginia Tech - <strong>Air</strong> <strong>Transportation</strong> <strong>Systems</strong> <strong>Laboratory</strong>26
General Observations• The time period between the leading aircraft arrival(i) on runway 09L and a single departure on runway36 is around 39 seconds. Define,t n− 36= time for n departures on runway 36t 1− 36= 39 secondst 2− 36= (39 + 80) = 119 secondst 3− 36= (39 + 80 + 80) = 199 secondst n− 36= 39 + E(t d)(n − 1) secondswhere:n = number of departures on runway 36per arrival gap on runway 09LE(t d) = expected value of time betweensuccessive departures on runway 36Virginia Tech - <strong>Air</strong> <strong>Transportation</strong> <strong>Systems</strong> <strong>Laboratory</strong>27
General Observationst n− 36= time for n departures on runway 36• For each successive pair of arrivals on theprimary runway (runway 09L-27R), we wouldhave to subtract ( t n− 36 ) seconds and checkthe suitability of each natural gap to release ndepartures on runway 36• The procedure is analogous to a singlerunway with mixed operationsVirginia Tech - <strong>Air</strong> <strong>Transportation</strong> <strong>Systems</strong> <strong>Laboratory</strong>28
Analysis of Crossing <strong>Runway</strong> Operations(IFR Case)Arrival-arrivalmatrix (Tij+Bij)- 39 secondsTime leftfor followingaircraft to reachrunway 09LthresholdVirginia Tech - <strong>Air</strong> <strong>Transportation</strong> <strong>Systems</strong> <strong>Laboratory</strong>29
Analysis of Crossing <strong>Runway</strong> Operations(IFR Case)verifyδ ij+ B ij3600 V j − 393600 V j≥ 2.0 nmDistancebetweenfollowing aircrafton runway 09Lto runwaythresholdPotentialdepartures onrunway 36 perarrival gap onrunway 09LVirginia Tech - <strong>Air</strong> <strong>Transportation</strong> <strong>Systems</strong> <strong>Laboratory</strong>30
Analysis of Crossing <strong>Runway</strong> Operations(IFR Case)ED g−ij= P ijDG ijTGED g−ij= equivalent departures per gap betweenaircraft i and jP ij= probability of i following jDG ij= Departures per gap between i and jTG = total gaps per hourSample calculationED s− s= 0.010 *1.0 *(30.97 − 1) = 0.3Total departureson runway 36considering allarrival gaps onrunway 09LVirginia Tech - <strong>Air</strong> <strong>Transportation</strong> <strong>Systems</strong> <strong>Laboratory</strong>31
Preliminary Conclusions• The total number of departures on runway 36is estimated to be 33 per hour• This is slightly more than the number ofarrivals on the primary runway (09L)• Processing departures on runway 36 isadvantageous:• 8 departures on runway 09L-27R per hour• 33 departures on runway 36-18 per hour• Both results assume arrival priority onrunway 09L-27RVirginia Tech - <strong>Air</strong> <strong>Transportation</strong> <strong>Systems</strong> <strong>Laboratory</strong>32
Extending the Analysis for<strong>Runway</strong> 09L and 36 as Dependent Pair• It is clear that departures operations onrunway 36 are clearly coupled to arrivals torunway 09L• Now we study the situation where arrival gapson runway 09L are increased allowing moredepartures on runway 36• As arrival gaps grow to infinity, the number ofdepartures on runway 36 increase to 45 perhour• The advantages in the Pareto diagram areshown in the next pageVirginia Tech - <strong>Air</strong> <strong>Transportation</strong> <strong>Systems</strong> <strong>Laboratory</strong>33
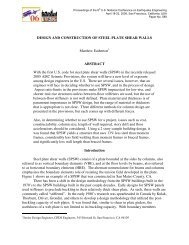
IFR <strong>Capacity</strong> Pareto Diagram(<strong>Runway</strong>s 09L and 36 as Coupled Pair)Saturation capacity for two runways operated with dependentoperations. Arrivals on runway 09L, departures on runway 36.Arrivals on runway 09L,departures on runway 36Mixed operationson runway 09LIFRConditionsVirginia Tech - <strong>Air</strong> <strong>Transportation</strong> <strong>Systems</strong> <strong>Laboratory</strong>34
<strong>Capacity</strong> Benefits• It is clear that an expansion of the Pareto diagram is abenefit to the capacity of the airport• Consider an operating point where the coupled runway pairhandles 33 departures and 31 arrivals, the single runway09L in mixed operations can only process 33 departures andand 15 arrivalsArrivals on runway 09L,departures on runway 36Mixed operationson runway 09LVirginia Tech - <strong>Air</strong> <strong>Transportation</strong> <strong>Systems</strong> <strong>Laboratory</strong>35
IFR <strong>Capacity</strong> Pareto Diagram(Coupled <strong>Runway</strong> Pair 09L / 36 + <strong>Runway</strong> 09R)Saturation capacity for three runways (coupled pair + singlerunway). Arrivals on runway 09L and 09R, departures onrunway 36 and 09R.IFR ConditionsMixed operationson runways 09Land 09R (no operationson runway 36)Arrivals on runway 09L,departures on runway 36and mixed operations on 09RVirginia Tech - <strong>Air</strong> <strong>Transportation</strong> <strong>Systems</strong> <strong>Laboratory</strong>36
Final Twist on Departure <strong>Capacity</strong>• As the arrivals on runway 09L are reduced to zero(allowing more departures on runway 36 during departurerush periods) it is clear that substantial departure capacitygains are possible operating the coupled pair withsequenced departures (as shown)• You can show that thedeparture saturationcapacity of the coupledpair is ~80 per hour• This in the endincreases thedeparture capacity ofthe airfield to 125 perhourVirginia Tech - <strong>Air</strong> <strong>Transportation</strong> <strong>Systems</strong> <strong>Laboratory</strong>37
<strong>Capacity</strong> Diagrams for Various <strong>Air</strong>portsCEE 5614Analysis of <strong>Air</strong> <strong>Transportation</strong> <strong>Systems</strong>Dr. Antonio A. TraniProfessorVirginia Tech - <strong>Air</strong> <strong>Transportation</strong> <strong>Systems</strong> <strong>Laboratory</strong>
FAA <strong>Air</strong>port <strong>Capacity</strong> Benchmarks• The FAA has conducteddetailed capacitystudies for the 31 mostimportant airports todetermine their VFRand IFR hour capacities• The details are includedin the FAA <strong>Air</strong>port<strong>Capacity</strong> benchmarkdocument• Document: http://www.faa.gov/about/office_org/headquarters_offices/ato/publications/bench/Virginia Tech - <strong>Air</strong> <strong>Transportation</strong> <strong>Systems</strong> <strong>Laboratory</strong>39
Summary of Top 31 <strong>Air</strong>ports<strong>Runway</strong> Hourly <strong>Capacity</strong><strong>Air</strong>port 3 Letter CodeVirginia Tech - <strong>Air</strong> <strong>Transportation</strong> <strong>Systems</strong> <strong>Laboratory</strong>40
Observations• <strong>Air</strong>ports with largest margins between VFR (Optimal)and IFR capacities are DFW (Dallas Forth Worth), DEN(Denver) and ORD (Chicago)• These airports have multiple parallel runways thatbenefit from VFR rules• Few airports such as San Diego (SAN), La Guardia(LGA), Chicago Midway (MDW) and Fort Lauderdale(FLL) have IFR capacities close to those for VFR• <strong>Capacity</strong> is affected by:• <strong>Runway</strong> configuration• Weather• <strong>Air</strong>craft fleet mixVirginia Tech - <strong>Air</strong> <strong>Transportation</strong> <strong>Systems</strong> <strong>Laboratory</strong>41
Planned Improvements (VFR Weather)• <strong>Air</strong>port authorities and the FAA have planned someimprovements to the top 31 airportsATL added a newrunway in 2006Virginia Tech - <strong>Air</strong> <strong>Transportation</strong> <strong>Systems</strong> <strong>Laboratory</strong>42
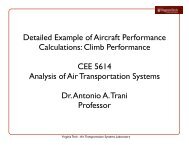
<strong>Air</strong>port # 1: Atlanta Hartsfield• The busiest airport in the World<strong>Air</strong>craft Class% MixSmall 2.3Large 78.56,400 feetB757 12.0Heavy 7.4ConditionHourly <strong>Capacity</strong>VFR 180-188Marginal VFR 172-174<strong>Capacity</strong> of 4 <strong>Runway</strong>sIFR 158-162Virginia Tech - <strong>Air</strong> <strong>Transportation</strong> <strong>Systems</strong> <strong>Laboratory</strong>43
<strong>Air</strong>port # 1: Atlanta Hartsfield• With 4 runways the hourly capacities of the airport are:VFR=180, MVFR =172 and IFR=158 per hourVFR Conditionssource: FAA <strong>Air</strong>port <strong>Capacity</strong> BenchmarksVirginia Tech - <strong>Air</strong> <strong>Transportation</strong> <strong>Systems</strong> <strong>Laboratory</strong>44
<strong>Air</strong>port # 1: Atlanta Hartsfield• With 5 runways the hourly capacities of the airport are:VFR=237, MVFR =229 and IFR=202 per hourVFR Conditionssource: FAA <strong>Air</strong>port <strong>Capacity</strong> BenchmarksVirginia Tech - <strong>Air</strong> <strong>Transportation</strong> <strong>Systems</strong> <strong>Laboratory</strong>45
<strong>Air</strong>port # 1: Atlanta Hartsfield• 4-runway Pareto diagramIFR Conditions• Note a smallreduction in thenumber of departuresunder IFR conditions• Departures wait forarrivals to crossthresholdsource: FAA <strong>Air</strong>port <strong>Capacity</strong> BenchmarksVirginia Tech - <strong>Air</strong> <strong>Transportation</strong> <strong>Systems</strong> <strong>Laboratory</strong>46
<strong>Air</strong>port # 1: Atlanta Hartsfield• Departures are issued clearance once thearriving aircraft crosses the threshold• For every arrival typically there is onedeparture on the close parallel runwayArrival1000 feet<strong>Runway</strong> 26R<strong>Runway</strong> 26LLine up and waitIFR ConditionsVirginia Tech - <strong>Air</strong> <strong>Transportation</strong> <strong>Systems</strong> <strong>Laboratory</strong>47
<strong>Air</strong>port # 2: Boston Logan<strong>Air</strong>craft Class% Mix<strong>Runway</strong>s 32 and 33L have10 degree offset headings<strong>Runway</strong> 32 is a visualrunwaySmall 15.2Large 70.0B757 10.3Heavy 4.5ConditionHourly <strong>Capacity</strong>4,800 feetVFR 123-131Marginal VFR 112-117IFR 90-93Virginia Tech - <strong>Air</strong> <strong>Transportation</strong> <strong>Systems</strong> <strong>Laboratory</strong>48
<strong>Air</strong>port # 2: Boston Logan• With 4 runways the hourly capacities of the airport are:VFR=123, MVFR =112 and IFR=90 per hourVFR Conditionssource: FAA <strong>Air</strong>port <strong>Capacity</strong> BenchmarksVirginia Tech - <strong>Air</strong> <strong>Transportation</strong> <strong>Systems</strong> <strong>Laboratory</strong>49
<strong>Air</strong>port # 2: Boston Logan• Pareto diagram (Arrivals on <strong>Runway</strong> 4R,Departures on runways 4R, 4L and 9)IFR Conditions• Note airport has anequivalent of onearrival runway in IFRconditions• Good departureratesource: FAA <strong>Air</strong>port <strong>Capacity</strong> BenchmarksVirginia Tech - <strong>Air</strong> <strong>Transportation</strong> <strong>Systems</strong> <strong>Laboratory</strong>50
<strong>Air</strong>port #3: Reagan National <strong>Air</strong>portPrimary runway is 19<strong>Runway</strong> 15 is limited toregional jets andturboprops<strong>Air</strong>craft Class% MixSmall 2.0Large 96.3B757 1.7Heavy 0.0ConditionHourly <strong>Capacity</strong>VFR ConditionsVFR 72-87Marginal VFR 60-84IFR 48-70Virginia Tech - <strong>Air</strong> <strong>Transportation</strong> <strong>Systems</strong> <strong>Laboratory</strong>51
<strong>Air</strong>port #3: Reagan National <strong>Air</strong>portVFR Conditionssource: FAA <strong>Air</strong>port <strong>Capacity</strong> BenchmarksVirginia Tech - <strong>Air</strong> <strong>Transportation</strong> <strong>Systems</strong> <strong>Laboratory</strong> 52
<strong>Air</strong>port #3: Reagan National <strong>Air</strong>portPrimary runway is 01<strong>Runway</strong> 33 is limited toregional jets andturboprops<strong>Runway</strong> 04 for GAaircraft<strong>Air</strong>craft Class% MixSmall 2.0Large 96.3B757 1.7Heavy 0.0ConditionHourly <strong>Capacity</strong>IFR ConditionsVFR 72-87Marginal VFR 60-84IFR 48-70Virginia Tech - <strong>Air</strong> <strong>Transportation</strong> <strong>Systems</strong> <strong>Laboratory</strong>53
<strong>Air</strong>port #3: Reagan National <strong>Air</strong>portIFR Conditions• Note airport has anequivalent of onearrival runway in IFRconditions• Modest departureratesource: FAA <strong>Air</strong>port <strong>Capacity</strong> BenchmarksVirginia Tech - <strong>Air</strong> <strong>Transportation</strong> <strong>Systems</strong> <strong>Laboratory</strong> 54