Nature, Distribution and Evolution of Poverty & Inequality in Uganda
Nature, Distribution and Evolution of Poverty & Inequality in Uganda
Nature, Distribution and Evolution of Poverty & Inequality in Uganda
- No tags were found...
You also want an ePaper? Increase the reach of your titles
YUMPU automatically turns print PDFs into web optimized ePapers that Google loves.
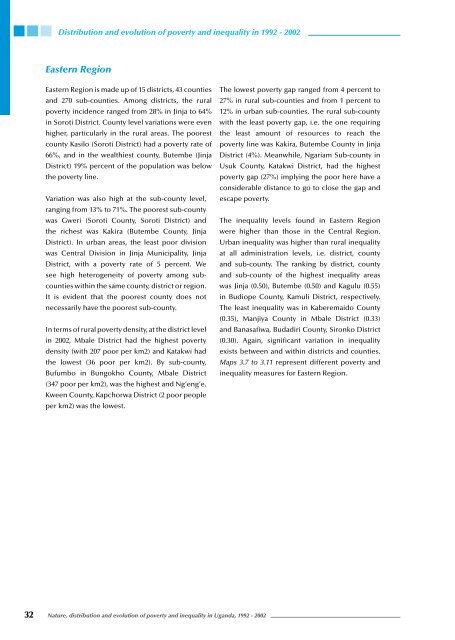
<strong>Distribution</strong> <strong>and</strong> evolution <strong>of</strong> poverty <strong>and</strong> <strong>in</strong>equality <strong>in</strong> 1992 - 2002Eastern RegionEastern Region is made up <strong>of</strong> 15 districts, 43 counties<strong>and</strong> 270 sub-counties. Among districts, the ruralpoverty <strong>in</strong>cidence ranged from 28% <strong>in</strong> J<strong>in</strong>ja to 64%<strong>in</strong> Soroti District. County level variations were evenhigher, particularly <strong>in</strong> the rural areas. The poorestcounty Kasilo (Soroti District) had a poverty rate <strong>of</strong>66%, <strong>and</strong> <strong>in</strong> the wealthiest county, Butembe (J<strong>in</strong>jaDistrict) 19% percent <strong>of</strong> the population was belowthe poverty l<strong>in</strong>e.Variation was also high at the sub-county level,rang<strong>in</strong>g from 13% to 71%. The poorest sub-countywas Gweri (Soroti County, Soroti District) <strong>and</strong>the richest was Kakira (Butembe County, J<strong>in</strong>jaDistrict). In urban areas, the least poor divisionwas Central Division <strong>in</strong> J<strong>in</strong>ja Municipality, J<strong>in</strong>jaDistrict, with a poverty rate <strong>of</strong> 5 percent. Wesee high heterogeneity <strong>of</strong> poverty among subcountieswith<strong>in</strong> the same county, district or region.It is evident that the poorest county does notnecessarily have the poorest sub-county.In terms <strong>of</strong> rural poverty density, at the district level<strong>in</strong> 2002, Mbale District had the highest povertydensity (with 207 poor per km2) <strong>and</strong> Katakwi hadthe lowest (36 poor per km2). By sub-county,Bufumbo <strong>in</strong> Bungokho County, Mbale District(347 poor per km2), was the highest <strong>and</strong> Ng’eng’e,Kween County, Kapchorwa District (2 poor peopleper km2) was the lowest.The lowest poverty gap ranged from 4 percent to27% <strong>in</strong> rural sub-counties <strong>and</strong> from 1 percent to12% <strong>in</strong> urban sub-counties. The rural sub-countywith the least poverty gap, i.e. the one requir<strong>in</strong>gthe least amount <strong>of</strong> resources to reach thepoverty l<strong>in</strong>e was Kakira, Butembe County <strong>in</strong> J<strong>in</strong>jaDistrict (4%). Meanwhile, Ngariam Sub-county <strong>in</strong>Usuk County, Katakwi District, had the highestpoverty gap (27%) imply<strong>in</strong>g the poor here have aconsiderable distance to go to close the gap <strong>and</strong>escape poverty.The <strong>in</strong>equality levels found <strong>in</strong> Eastern Regionwere higher than those <strong>in</strong> the Central Region.Urban <strong>in</strong>equality was higher than rural <strong>in</strong>equalityat all adm<strong>in</strong>istration levels, i.e. district, county<strong>and</strong> sub-county. The rank<strong>in</strong>g by district, county<strong>and</strong> sub-county <strong>of</strong> the highest <strong>in</strong>equality areaswas J<strong>in</strong>ja (0.50), Butembe (0.50) <strong>and</strong> Kagulu (0.55)<strong>in</strong> Budiope County, Kamuli District, respectively.The least <strong>in</strong>equality was <strong>in</strong> Kaberemaido County(0.35), Manjiya County <strong>in</strong> Mbale District (0.33)<strong>and</strong> Banasafiwa, Budadiri County, Sironko District(0.30). Aga<strong>in</strong>, significant variation <strong>in</strong> <strong>in</strong>equalityexists between <strong>and</strong> with<strong>in</strong> districts <strong>and</strong> counties.Maps 3.7 to 3.11 represent different poverty <strong>and</strong><strong>in</strong>equality measures for Eastern Region.32 <strong>Nature</strong>, distribution <strong>and</strong> evolution <strong>of</strong> poverty <strong>and</strong> <strong>in</strong>equality <strong>in</strong> Ug<strong>and</strong>a, 1992 - 2002


