Nature, Distribution and Evolution of Poverty & Inequality in Uganda
Nature, Distribution and Evolution of Poverty & Inequality in Uganda
Nature, Distribution and Evolution of Poverty & Inequality in Uganda
- No tags were found...

Create successful ePaper yourself
Turn your PDF publications into a flip-book with our unique Google optimized e-Paper software.
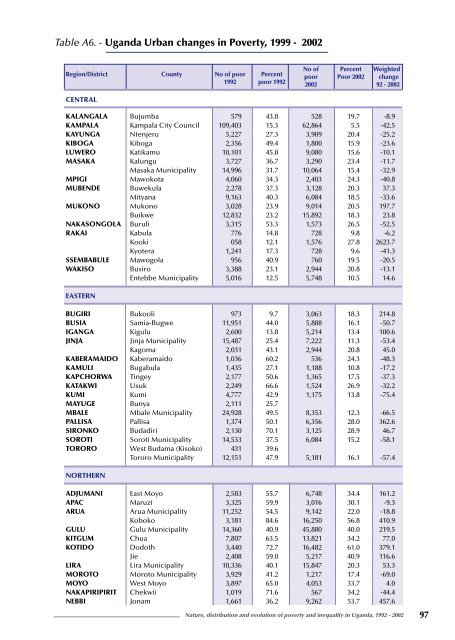
Table A6. - Ug<strong>and</strong>a Urban changes <strong>in</strong> <strong>Poverty</strong>, 1999 - 2002Region/District County No <strong>of</strong> poor Percent1992 poor 1992No <strong>of</strong> Percent Weightedpoor Poor 2002 change2002 92 - 2002CENTRALKALANGALA Bujumba 579 43.8 528 19.7 -8.9KAMPALA Kampala City Council 109,403 15.3 62,864 5.5 -42.5KAYUNGA Ntenjeru 5,227 27.3 3,909 20.4 -25.2KIBOGA Kiboga 2,356 49.4 1,800 15.9 -23.6LUWERO Katikamu 10,101 45.8 9,080 15.6 -10.1MASAKA Kalungu 3,727 36.7 3,290 23.4 -11.7Masaka Municipality 14,996 31.7 10,064 15.4 -32.9MPIGI Mawokota 4,060 34.3 2,403 24.3 -40.8MUBENDE Buwekula 2,278 37.3 3,128 20.3 37.3Mityana 9,163 40.3 6,084 18.5 -33.6MUKONO Mukono 3,028 23.9 9,014 20.5 197.7Buikwe 12,832 23.2 15,892 18.3 23.8NAKASONGOLA Buruli 3,315 53.3 1,573 26.5 -52.5RAKAI Kabula 776 14.8 728 9.8 -6.2Kooki 058 12.1 1,576 27.8 2623.7Kyotera 1,241 17.3 728 9.6 -41.3SSEMBABULE Mawogola 956 40.9 760 19.5 -20.5WAKISO Busiro 3,388 23.1 2,944 20.8 -13.1Entebbe Municipality 5,016 12.5 5,748 10.5 14.6EASTERNBUGIRI Bukooli 973 9.7 3,063 18.3 214.8BUSIA Samia-Bugwe 11,951 44.0 5,888 16.1 -50.7IGANGA Kigulu 2,600 13.8 5,214 13.4 100.6JINJA J<strong>in</strong>ja Municipality 15,487 25.4 7,222 11.3 -53.4Kagoma 2,031 43.1 2,944 20.8 45.0KABERAMAIDO Kaberamaido 1,036 60.2 536 24.3 -48.3KAMULI Bugabula 1,435 27.1 1,188 10.8 -17.2KAPCHORWA T<strong>in</strong>gey 2,177 50.6 1,365 17.5 -37.3KATAKWI Usuk 2,249 66.6 1,524 26.9 -32.2KUMI Kumi 4,777 42.9 1,175 13.8 -75.4MAYUGE Bunya 2,111 25.7MBALE Mbale Municipality 24,928 49.5 8,353 12.3 -66.5PALLISA Pallisa 1,374 50.1 6,356 28.0 362.6SIRONKO Budadiri 2,130 70.1 3,125 28.9 46.7SOROTI Soroti Municipality 14,533 37.5 6,084 15.2 -58.1TORORO West Budama (Kisoko) 431 39.6Tororo Municipality 12,151 47.9 5,181 16.1 -57.4NORTHERNADJUMANI East Moyo 2,583 55.7 6,748 34.4 161.2APAC Maruzi 3,325 59.9 3,016 30.1 -9.3ARUA Arua Municipality 11,252 54.5 9,142 22.0 -18.8Koboko 3,181 84.6 16,250 56.8 410.9GULU Gulu Municipality 14,360 40.9 45,880 40.0 219.5KITGUM Chua 7,807 63.5 13,821 34.2 77.0KOTIDO Dodoth 3,440 72.7 16,482 61.0 379.1Jie 2,408 59.0 5,217 40.9 116.6LIRA Lira Municipality 10,336 40.1 15,847 20.3 53.3MOROTO Moroto Municipality 3,929 41.2 1,217 17.4 -69.0MOYO West Moyo 3,897 65.0 4,053 33.7 4.0NAKAPIRIPIRIT Chekwii 1,019 71.6 567 34.2 -44.4NEBBI Jonam 1,661 36.2 9,262 53.7 457.6<strong>Nature</strong>, distribution <strong>and</strong> evolution <strong>of</strong> poverty <strong>and</strong> <strong>in</strong>equality <strong>in</strong> Ug<strong>and</strong>a, 1992 - 2002 97