Nature, Distribution and Evolution of Poverty & Inequality in Uganda
Nature, Distribution and Evolution of Poverty & Inequality in Uganda
Nature, Distribution and Evolution of Poverty & Inequality in Uganda
- No tags were found...

You also want an ePaper? Increase the reach of your titles
YUMPU automatically turns print PDFs into web optimized ePapers that Google loves.
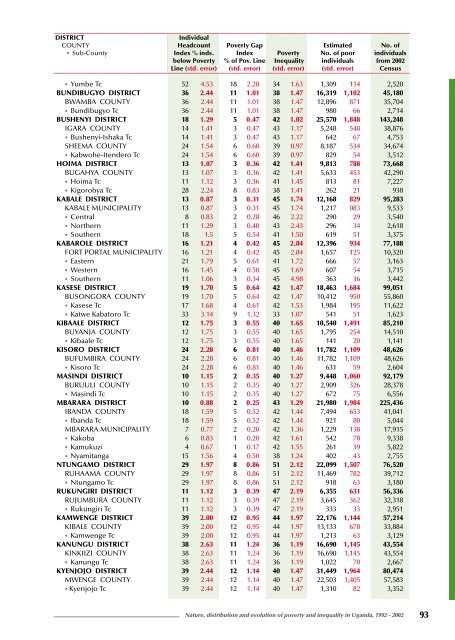
DISTRICTIndividualCOUNTY Headcount <strong>Poverty</strong> Gap Estimated No. <strong>of</strong>• Sub-County Index % <strong>in</strong>ds. Index <strong>Poverty</strong> No. <strong>of</strong> poor <strong>in</strong>dividualsbelow <strong>Poverty</strong> % <strong>of</strong> Pov. L<strong>in</strong>e <strong>Inequality</strong> <strong>in</strong>dividuals from 2002L<strong>in</strong>e (std. error) (std. error) (std. error) (std. error) Census• Yumbe Tc 52 4.53 18 2.28 34 1.63 1,309 114 2,520BUNDIBUGYO DISTRICT 36 2.44 11 1.01 38 1.47 16,319 1,102 45,180BWAMBA COUNTY 36 2.44 11 1.01 38 1.47 12,896 871 35,704• Bundibugyo Tc 36 2.44 11 1.01 38 1.47 980 66 2,714BUSHENYI DISTRICT 18 1.29 5 0.47 42 1.02 25,570 1,848 143,248IGARA COUNTY 14 1.41 3 0.47 43 1.17 5,248 548 38,876• Bushenyi-Ishaka Tc 14 1.41 3 0.47 43 1.17 642 67 4,753SHEEMA COUNTY 24 1.54 6 0.60 39 0.97 8,187 534 34,674• Kabwohe-Itendero Tc 24 1.54 6 0.60 39 0.97 829 54 3,512HOIMA DISTRICT 13 1.07 3 0.36 42 1.41 9,813 788 73,668BUGAHYA COUNTY 13 1.07 3 0.36 42 1.41 5,633 453 42,290• Hoima Tc 11 1.12 3 0.36 41 1.45 813 81 7,227• Kigorobya Tc 28 2.24 8 0.83 38 1.41 262 21 938KABALE DISTRICT 13 0.87 3 0.31 45 1.74 12,168 829 95,283KABALE MUNICIPALITY 13 0.87 3 0.31 45 1.74 1,217 083 9,533• Central 8 0.83 2 0.28 46 2.22 290 29 3,540• Northern 11 1.29 3 0.40 43 2.43 296 34 2,618• Southern 18 1.5 5 0.54 41 1.50 619 51 3,375KABAROLE DISTRICT 16 1.21 4 0.42 45 2.84 12,396 934 77,188FORT PORTAL MUNICIPALITY 16 1.21 4 0.42 45 2.84 1,657 125 10,320• Eastern 21 1.79 5 0.61 41 1.72 666 57 3,163• Western 16 1.45 4 0.50 45 1.69 607 54 3,715• Southern 11 1.06 3 0.34 45 4.98 363 36 3,442KASESE DISTRICT 19 1.70 5 0.64 42 1.47 18,463 1,684 99,051BUSONGORA COUNTY 19 1.70 5 0.64 42 1.47 10,412 950 55,860• Kasese Tc 17 1.68 4 0.61 42 1.53 1,984 195 11,622• Katwe Kabatoro Tc 33 3.14 9 1.32 33 1.07 541 51 1,623KIBAALE DISTRICT 12 1.75 3 0.55 40 1.65 10,540 1,491 85,210BUYANJA COUNTY 12 1.75 3 0.55 40 1.65 1,795 254 14,510• Kibaale Tc 12 1.75 3 0.55 40 1.65 141 20 1,141KISORO DISTRICT 24 2.28 6 0.81 40 1.46 11,782 1,109 48,626BUFUMBIRA COUNTY 24 2.28 6 0.81 40 1.46 11,782 1,109 48,626• Kisoro Tc 24 2.28 6 0.81 40 1.46 631 59 2,604MASINDI DISTRICT 10 1.15 2 0.35 40 1.27 9,448 1,060 92,179BURUULI COUNTY 10 1.15 2 0.35 40 1.27 2,909 326 28,378• Mas<strong>in</strong>di Tc 10 1.15 2 0.35 40 1.27 672 75 6,556MBARARA DISTRICT 10 0.88 2 0.25 43 1.29 21,980 1,984 225,436IBANDA COUNTY 18 1.59 5 0.52 42 1.44 7,494 653 41,041• Ib<strong>and</strong>a Tc 18 1.59 5 0.52 42 1.44 921 80 5,044MBARARA MUNICIPALITY 7 0.77 2 0.20 42 1.36 1,229 138 17,915• Kakoba 6 0.83 1 0.20 42 1.61 542 78 9,338• Kamukuzi 4 0.67 1 0.17 42 1.55 261 39 5,822• Nyamitanga 15 1.56 4 0.50 38 1.24 402 43 2,755NTUNGAMO DISTRICT 29 1.97 8 0.86 51 2.12 22,099 1,507 76,520RUHAAMA COUNTY 29 1.97 8 0.86 51 2.12 11,469 782 39,712• Ntungamo Tc 29 1.97 8 0.86 51 2.12 918 63 3,180RUKUNGIRI DISTRICT 11 1.12 3 0.39 47 2.19 6,355 631 56,336RUJUMBURA COUNTY 11 1.12 3 0.39 47 2.19 3,645 362 32,318• Rukungiri Tc 11 1.12 3 0.39 47 2.19 333 33 2,951KAMWENGE DISTRICT 39 2.00 12 0.95 44 1.97 22,176 1,144 57,214KIBALE COUNTY 39 2.00 12 0.95 44 1.97 13,133 678 33,884• Kamwenge Tc 39 2.00 12 0.95 44 1.97 1,213 63 3,129KANUNGU DISTRICT 38 2.63 11 1.24 36 1.19 16,690 1,145 43,554KINKIIZI COUNTY 38 2.63 11 1.24 36 1.19 16,690 1,145 43,554• Kanungu Tc 38 2.63 11 1.24 36 1.19 1,022 70 2,667KYENJOJO DISTRICT 39 2.44 12 1.14 40 1.47 31,449 1,964 80,474MWENGE COUNTY 39 2.44 12 1.14 40 1.47 22,503 1,405 57,583• Kyenjojo Tc 39 2.44 12 1.14 40 1.47 1,310 82 3,352<strong>Nature</strong>, distribution <strong>and</strong> evolution <strong>of</strong> poverty <strong>and</strong> <strong>in</strong>equality <strong>in</strong> Ug<strong>and</strong>a, 1992 - 2002 93