Nature, Distribution and Evolution of Poverty & Inequality in Uganda
Nature, Distribution and Evolution of Poverty & Inequality in Uganda
Nature, Distribution and Evolution of Poverty & Inequality in Uganda
- No tags were found...

You also want an ePaper? Increase the reach of your titles
YUMPU automatically turns print PDFs into web optimized ePapers that Google loves.
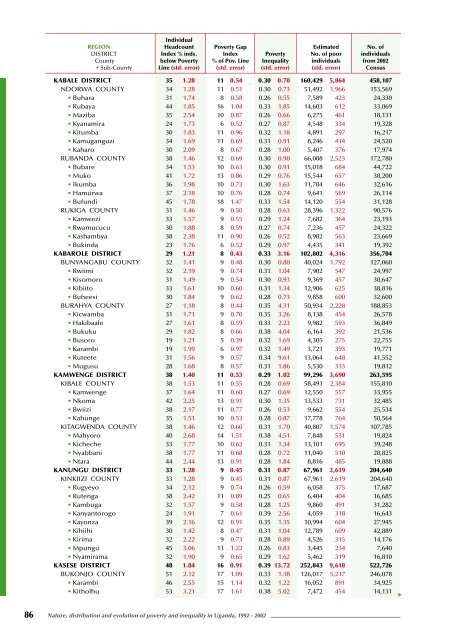
IndividualREGION Headcount <strong>Poverty</strong> Gap Estimated No. <strong>of</strong>DISTRICT Index % <strong>in</strong>ds. Index <strong>Poverty</strong> No. <strong>of</strong> poor <strong>in</strong>dividualsCounty below <strong>Poverty</strong> % <strong>of</strong> Pov. L<strong>in</strong>e <strong>Inequality</strong> <strong>in</strong>dividuals from 2002• Sub-County L<strong>in</strong>e (std. error) (std. error) (std. error) (std. error) CensusKABALE DISTRICT 35 1.28 11 0.54 0.30 0.70 160,429 5,864 458,107NDORWA COUNTY 34 1.28 11 0.51 0.30 0.73 51,492 1,966 153,569• Buhara 31 1.74 8 0.58 0.26 0.55 7,589 423 24,330• Rubaya 44 1.85 16 1.04 0.33 1.85 14,603 612 33,069• Maziba 35 2.54 10 0.87 0.26 0.66 6,275 461 18,131• Kyanamira 24 1.73 6 0.52 0.27 0.87 4,548 334 19,328• Kitumba 30 1.83 11 0.96 0.32 1.18 4,891 297 16,217• Kamuganguzi 34 1.69 11 0.69 0.31 0.91 8,246 414 24,520• Kaharo 30 2.09 8 0.67 0.28 1.00 5,407 376 17,974RUBANDA COUNTY 38 1.46 12 0.69 0.30 0.90 66,088 2,523 172,780• Bubare 34 1.53 10 0.63 0.30 0.91 15,018 684 44,722• Muko 41 1.72 13 0.86 0.29 0.76 15,544 657 38,200• Ikumba 36 1.98 10 0.73 0.30 1.63 11,784 646 32,616• Hamurwa 37 2.18 10 0.76 0.28 0.74 9,641 569 26,114• Bufundi 45 1.78 18 1.47 0.33 1.54 14,120 554 31,128RUKIGA COUNTY 31 1.46 9 0.50 0.28 0.63 28,396 1,322 90,576• Kamwezi 33 1.57 9 0.55 0.29 1.24 7,682 364 23,193• Rwamucucu 30 1.88 8 0.59 0.27 0.74 7,236 457 24,322• Kashambya 38 2.38 11 0.90 0.26 0.52 8,982 563 23,669• Buk<strong>in</strong>da 23 1.76 6 0.52 0.29 0.97 4,435 341 19,392KABAROLE DISTRICT 29 1.21 8 0.43 0.33 3.16 102,802 4,316 356,704BUNYANGABU COUNTY 32 1.41 9 0.48 0.30 0.80 40,024 1,792 127,060• Rwiimi 32 2.19 9 0.74 0.31 1.04 7,902 547 24,997• Kisomoro 31 1.49 9 0.54 0.30 0.93 9,369 457 30,647• Kibiito 33 1.61 10 0.60 0.31 1.34 12,906 625 38,816• Buheesi 30 1.84 9 0.62 0.28 0.73 9,858 600 32,600BURAHYA COUNTY 27 1.18 8 0.44 0.35 4.31 50,934 2,228 188,853• Kicwamba 31 1.71 9 0.70 0.35 3.26 8,138 454 26,578• Hakibaale 27 1.61 8 0.59 0.33 2.23 9,982 593 36,849• Bukuku 29 1.82 8 0.66 0.38 4.04 6,164 392 21,536• Busoro 19 1.21 5 0.39 0.32 1.69 4,305 275 22,755• Karambi 19 1.99 6 0.97 0.32 1.49 3,721 393 19,771• Ruteete 31 1.56 9 0.57 0.34 9.61 13,064 648 41,552• Mugusu 28 1.68 8 0.57 0.31 1.86 5,530 333 19,812KAMWENGE DISTRICT 38 1.40 11 0.53 0.29 1.02 99,296 3,690 263,595KIBALE COUNTY 38 1.53 11 0.55 0.28 0.69 58,491 2,384 155,810• Kamwenge 37 1.64 11 0.60 0.27 0.69 12,550 557 33,955• Nkoma 42 2.25 13 0.91 0.30 1.35 13,533 731 32,485• Bwiizi 38 2.17 11 0.77 0.26 0.53 9,662 554 25,534• Kahunge 35 1.51 10 0.53 0.28 0.87 17,778 764 50,564KITAGWENDA COUNTY 38 1.46 12 0.60 0.31 1.70 40,807 1,574 107,785• Mahyoro 40 2.68 14 1.51 0.38 4.51 7,848 531 19,824• Kicheche 33 1.77 10 0.62 0.31 1.34 13,101 695 39,248• Nyabbani 38 1.77 11 0.68 0.28 0.72 11,040 510 28,825• Ntara 44 2.44 13 0.91 0.28 1.84 8,816 485 19,888KANUNGU DISTRICT 33 1.28 9 0.45 0.31 0.87 67,961 2,619 204,640KINKIIZI COUNTY 33 1.28 9 0.45 0.31 0.87 67,961 2,619 204,640• Rugyeyo 34 2.12 9 0.74 0.26 0.59 6,058 375 17,687• Rutenga 38 2.42 11 0.89 0.25 0.65 6,404 404 16,685• Kambuga 32 1.57 9 0.58 0.28 1.25 9,860 491 31,282• Kanyantorogo 24 1.91 7 0.61 0.39 2.56 4,059 318 16,643• Kayonza 39 2.16 12 0.91 0.35 1.35 10,994 604 27,945• Kihiihi 30 1.42 8 0.47 0.31 1.04 12,789 609 42,889• Kirima 32 2.22 9 0.73 0.28 0.89 4,526 315 14,176• Mpungu 45 3.06 13 1.22 0.26 0.83 3,445 234 7,640• Nyamirama 32 1.90 9 0.65 0.29 1.62 5,462 319 16,810KASESE DISTRICT 48 1.84 16 0.91 0.39 13.72 252,843 9,618 522,726BUKONJO COUNTY 51 2.12 17 1.09 0.33 1.38 126,017 5,217 246,078• Karambi 46 2.55 15 1.14 0.32 1.22 16,052 891 34,925• Kitholhu 53 3.21 17 1.61 0.38 5.02 7,472 454 14,13186 <strong>Nature</strong>, distribution <strong>and</strong> evolution <strong>of</strong> poverty <strong>and</strong> <strong>in</strong>equality <strong>in</strong> Ug<strong>and</strong>a, 1992 - 2002