Ammended NI 43-101 Technical Report on the Biely ... - EMED Mining
Ammended NI 43-101 Technical Report on the Biely ... - EMED Mining
Ammended NI 43-101 Technical Report on the Biely ... - EMED Mining

Create successful ePaper yourself
Turn your PDF publications into a flip-book with our unique Google optimized e-Paper software.
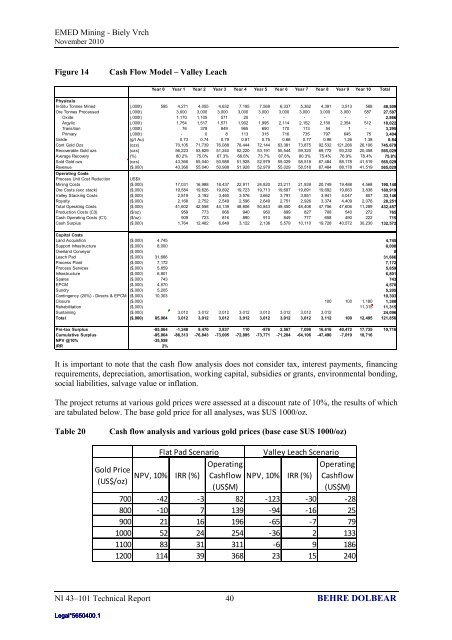
<strong>EMED</strong> <strong>Mining</strong> - <strong>Biely</strong> VrchNovember 2010Figure 14Cash Flow Model – Valley LeachYear 0 Year 1 Year 2 Year 3 Year 4 Year 5 Year 6 Year 7 Year 8 Year 9 Year 10 TotalPhysicalsIn-Situ T<strong>on</strong>nes Mined (,000t) 595 4,271 4,055 4,632 7,195 7,569 6,337 5,362 4,391 3,513 588 48,509Ore T<strong>on</strong>nes Processed (,000t) 3,000 3,000 3,000 3,000 3,000 3,000 3,000 3,000 3,000 587 27,587Oxide (,000t) 1,170 1,105 571 20 - - - - - - 2,866Argylic (,000t) 1,754 1,517 1,571 1,902 1,995 2,114 2,152 2,150 2,354 512 18,022Transiti<strong>on</strong> (,000t) 76 378 849 965 690 170 113 54 1 - 3,295Primary (,000t) - 0 8 113 315 716 735 797 645 75 3,404Grade (g/t Au) 0.73 0.74 0.79 0.81 0.75 0.66 0.77 0.96 1.26 1.38 0.84C<strong>on</strong>t Gold Ozs (ozs) 70,105 71,739 76,088 78,444 72,144 63,381 73,875 92,532 121,266 26,106 745,679Recoverable Gold ozs (ozs) 56,223 53,829 51,240 52,220 53,191 55,544 59,320 69,772 93,232 20,458 565,029Average Recovery (%) 80.2% 75.0% 67.3% 66.6% 73.7% 87.6% 80.3% 75.4% 76.9% 78.4% 75.8%Sold Gold ozs (ozs) <str<strong>on</strong>g>43</str<strong>on</strong>g>,366 55,040 50,988 51,928 52,979 55,029 58,518 67,484 88,178 41,519 565,029Revenue ($,000) <str<strong>on</strong>g>43</str<strong>on</strong>g>,366 55,040 50,988 51,928 52,979 55,029 58,518 67,484 88,178 41,519 565,029Operating CostsProcess Unit Cost Reducti<strong>on</strong> US$/t<strong>Mining</strong> Costs ($,000) 17,031 16,988 18,<str<strong>on</strong>g>43</str<strong>on</strong>g>7 22,911 24,820 23,211 21,939 20,749 19,488 4,568 190,140Ore Costs (exc stack) ($,000) 19,584 19,626 19,692 19,723 19,713 19,697 19,691 19,692 19,663 3,838 180,919Valley Stacking Costs ($,000) 2,819 3,192 3,460 3,576 3,662 3,791 3,851 3,941 4,047 807 33,146Royalty ($,000) 2,168 2,752 2,549 2,596 2,649 2,751 2,926 3,374 4,409 2,076 28,251Total Operating Costs ($,000) 41,602 42,558 44,139 48,806 50,8<str<strong>on</strong>g>43</str<strong>on</strong>g> 49,450 48,408 47,756 47,606 11,289 <str<strong>on</strong>g>43</str<strong>on</strong>g>2,457Producti<strong>on</strong> Costs (C3) ($/oz) 959 773 866 940 960 899 827 708 540 272 765Cash Operating Costs (C1) ($/oz) 909 723 816 890 910 849 777 658 490 222 715Cash Surplus ($,000) 1,764 12,482 6,849 3,122 2,136 5,579 10,110 19,728 40,572 30,230 132,572Capital CostsLand Acquisti<strong>on</strong> ($,000) 4,745 4,745Support Infrastructure ($,000) 8,000 8,000Overland C<strong>on</strong>veyor ($,000) 0Leach Pad ($,000) 31,666 31,666Process Plant ($,000) 7,172 7,172Process Services ($,000) 5,859 5,859Infrastructure ($,000) 6,801 6,801Spares ($,000) 7<str<strong>on</strong>g>43</str<strong>on</strong>g> 7<str<strong>on</strong>g>43</str<strong>on</strong>g>EPCM ($,000) 4,570 4,570Sundry ($,000) 5,205 5,205C<strong>on</strong>tingency (20%) - Directs & EPCM ($,000) 10,303 10,303Closure ($,000) 100 100 1,180 1,380Rehabilitati<strong>on</strong> ($,000) 11,315 11,315Sustaining ($,000) 3,012 3,012 3,012 3,012 3,012 3,012 3,012 3,012 24,096Total ($,000) 85,064 3,012 3,012 3,012 3,012 3,012 3,012 3,012 3,112 100 12,495 121,856Pre-tax Surplus -85,064 -1,248 9,470 3,837 110 -876 2,567 7,098 16,616 40,472 17,735 10,716Cumulative Surplus -85,064 -86,313 -76,8<str<strong>on</strong>g>43</str<strong>on</strong>g> -73,005 -72,895 -73,771 -71,204 -64,106 -47,490 -7,019 10,716NPV @10% -35,558IRR 2%It is important to note that <strong>the</strong> cash flow analysis does not c<strong>on</strong>sider tax, interest payments, financingrequirements, depreciati<strong>on</strong>, amortisati<strong>on</strong>, working capital, subsidies or grants, envir<strong>on</strong>mental b<strong>on</strong>ding,social liabilities, salvage value or inflati<strong>on</strong>.The project returns at various gold prices were assessed at a discount rate of 10%, <strong>the</strong> results of whichare tabulated below. The base gold price for all analyses, was $US 1000/oz.Table 20Cash flow analysis and various gold prices (base case $US 1000/oz)Gold Price(US$/oz)Flat Pad ScenarioOperatingNPV, 10% IRR (%) Cashflow(US$M)Valley Leach ScenarioOperatingCashflow(US$M)NPV, 10% IRR (%)700 ‐42 ‐3 82 ‐123 ‐30 ‐28800 ‐10 7 139 ‐94 ‐16 25900 21 16 196 ‐65 ‐7 791000 52 24 254 ‐36 2 1331100 83 31 311 ‐6 9 1861200 114 39 368 23 15 240<str<strong>on</strong>g>NI</str<strong>on</strong>g> <str<strong>on</strong>g>43</str<strong>on</strong>g>–<str<strong>on</strong>g>101</str<strong>on</strong>g> <str<strong>on</strong>g>Technical</str<strong>on</strong>g> <str<strong>on</strong>g>Report</str<strong>on</strong>g> 40 BEHRE DOLBEARLegal*5650400.1