CORINE Land Cover 2006 for Continental Portugal
CORINE Land Cover 2006 for Continental Portugal
CORINE Land Cover 2006 for Continental Portugal

You also want an ePaper? Increase the reach of your titles
YUMPU automatically turns print PDFs into web optimized ePapers that Google loves.
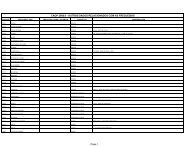
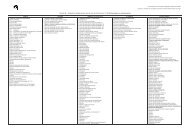
Table 7 – Examples of the tools created by the National Technical Team <strong>for</strong> the extension of Interchange 2.0.<br />
Button Description of functionality<br />
<strong>CORINE</strong> <strong>Land</strong> <strong>Cover</strong> <strong>2006</strong> <strong>for</strong> <strong>Continental</strong> <strong>Portugal</strong> 13<br />
Caetano et al., 2009<br />
This button zooms the view(s) to a previously defined scale.<br />
This button pulls the dialog box <strong>for</strong> searching the shapefile based on a chosen field. The script<br />
steps through all polygons coded in the chosen field with value 1.<br />
This button stretches the values of the Digital Numbers <strong>for</strong> each band of the image present in the<br />
view.<br />
This tool enables the user to click on a polygon and check the online official description of the<br />
respective CLC class.<br />
This tool is used to mark cells of a control grid as “done”.<br />
This tool transfers the clicked polygon(s) to Google Earth.<br />
This tool lists every available image <strong>for</strong> the clicked area in the view. The user then selects from the<br />
list, the ones to be loaded.<br />
This tool loads into the view orthorectified aerial images from 1995 available in the clicked area or<br />
location.<br />
2.4 Production Production of of of CHA06_PT<br />
CHA06_PT<br />
The main task in this project was the production of the CHA06_PT database, which<br />
consisted in computer-assisted visual interpretation of satellite images of the years 2000<br />
and <strong>2006</strong>. The image interpretation procedure included a visual comparison between the<br />
2000 and <strong>2006</strong> satellite images, the detection of real changes visible in the images, and<br />
the delineation of change polygons that fulfilled the technical specifications of the<br />
product (EEA, 2007). The changes that were mapped were the ones that occurred between<br />
2000 and <strong>2006</strong>, and were detectable in the base data, larger than 5 ha and wider than<br />
100m. The map production specifications <strong>for</strong> CHA06_PT differed from the ones of CLC-<br />
Changes-1990-2000-PT, in the fact that <strong>for</strong> CHA06_PT all the changes larger than 5 ha<br />
were mapped. When CLC-Changes-1990-2000-PT was produced the areas that were not<br />
contiguous to polygons of the same class already present in 1990, were only mapped if<br />
they had a minimum of 25 ha (Caetano et al., 2009b). The delineation of changes was<br />
based on the polygons of CLC00_PT in order to avoid the creation of sliver polygons when<br />
integrating that map with CHA06_PT to produce CLC06_PT. The CHA06_PT database was<br />
produced at Working Unit (WU) level. The same way as in the predecessor project, i.e.<br />
CLC2000 <strong>for</strong> <strong>Continental</strong> <strong>Portugal</strong>, each WU corresponded to a sheet of the National Map<br />
Series 1: 100 000 (Figure 9).