2000 - Draper Laboratory
2000 - Draper Laboratory
2000 - Draper Laboratory
- No tags were found...

You also want an ePaper? Increase the reach of your titles
YUMPU automatically turns print PDFs into web optimized ePapers that Google loves.
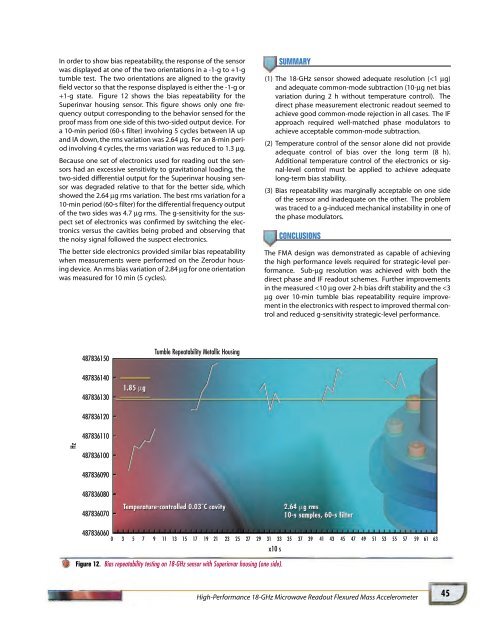
In order to show bias repeatability, the response of the sensorwas displayed at one of the two orientations in a -1-g to +1-gtumble test. The two orientations are aligned to the gravityfield vector so that the response displayed is either the -1-g or+1-g state. Figure 12 shows the bias repeatability for theSuperinvar housing sensor. This figure shows only one frequencyoutput corresponding to the behavior sensed for theproof mass from one side of this two-sided output device. Fora 10-min period (60-s filter) involving 5 cycles between IA upand IA down, the rms variation was 2.64 µg. For an 8-min periodinvolving 4 cycles, the rms variation was reduced to 1.3 µg.Because one set of electronics used for reading out the sensorshad an excessive sensitivity to gravitational loading, thetwo-sided differential output for the Superinvar housing sensorwas degraded relative to that for the better side, whichshowed the 2.64 µg rms variation. The best rms variation for a10-min period (60-s filter) for the differential frequency outputof the two sides was 4.7 µg rms. The g-sensitivity for the suspectset of electronics was confirmed by switching the electronicsversus the cavities being probed and observing thatthe noisy signal followed the suspect electronics.The better side electronics provided similar bias repeatabilitywhen measurements were performed on the Zerodur housingdevice. An rms bias variation of 2.84 µg for one orientationwas measured for 10 min (5 cycles).SUMMARY(1) The 18-GHz sensor showed adequate resolution (