Unaudited Financial Results=For the quarter ended 30 September 2007Net Asset ValueNet Asset ValueGroupas at30 Sep 07Groupas at31 Dec 06Companyas at30 Sep 07Companyas at31 Dec 06Total net asset value ($’000) 1,541,371 1,374,330 1,638,209 1,399,182Total number of ordinary shares on issue used in1,282,452 1,279,687 1,282,452 1,279,687calculation of net asset value per share (‘000)Net asset value per ordinary share ($ per share) $1.20 $1.07 $1.28 $1.09The following table reconciles the unconsolidated net asset value as at the beginning of the quarter to theunconsolidated net asset value as at the end of the quarter.Quarter ended 30 Sep 07 Quarter ended 31 Dec 06CompanyNet Asset Valueper ordinary shareCompanyNet Asset Valueper ordinary share$’000$ per share$’000$ per shareNet asset value/NAV per share at beginning of thequarter 1,611,598 1.26 1,308,913 1.02Increase in investments due to capital revaluations(listed investments) 2,022 - 45,066 0.04Increase in investments due to capital revaluations(unlisted investments) 71,771 0.06 49,078 0.04Increase in investments due to FX revaluations (listedinvestments) 4,803 - 6,121 -Increase in investments due to FX revaluations(unlisted investments) 10,726 0.01 (6,578) (0.01)Dividends declared/paid (53,107) (0.04) - -Base management fees incurred (4,586) - (3,144) -Issue of ordinary shares 3,146 - - -Capital raising costs incurred (92) - - -Movement in the fair value of FX forward contracts(income hedges) 687 - 915 -Impact of foreign exchange movements on otherbalances (7,063) (0.01) - -Other items (individually are not material) (1,696) - (1,189) -Net Assets/NAV per share as at period end 1,638,209 1.28 1,399,182 1.09<strong>Macquarie</strong> <strong>International</strong> <strong>Infrastructure</strong> <strong>Fund</strong> <strong>Limited</strong> Page 4
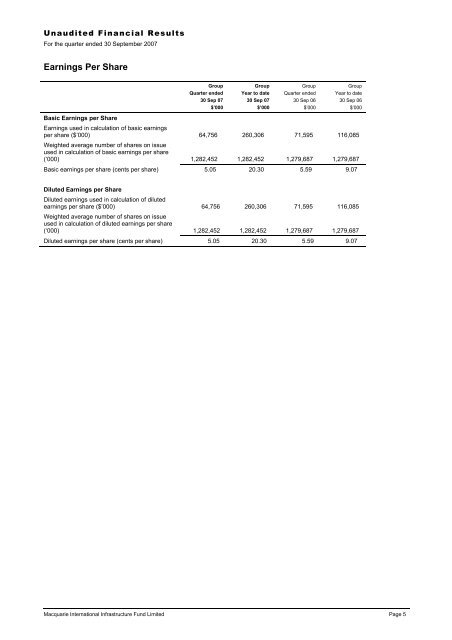
Unaudited Financial Results=For the quarter ended 30 September 2007Earnings Per ShareBasic Earnings per ShareGroupQuarter ended30 Sep 07$’000GroupYear to date30 Sep 07$’000GroupQuarter ended30 Sep 06$’000GroupYear to date30 Sep 06$’000Earnings used in calculation of basic earningsper share ($’000) 64,756 260,306 71,595 116,085Weighted average number of shares on issueused in calculation of basic earnings per share(‘000) 1,282,452 1,282,452 1,279,687 1,279,687Basic earnings per share (cents per share) 5.05 20.30 5.59 9.07Diluted Earnings per ShareDiluted earnings used in calculation of dilutedearnings per share ($’000) 64,756 260,306 71,595 116,085Weighted average number of shares on issueused in calculation of diluted earnings per share(‘000) 1,282,452 1,282,452 1,279,687 1,279,687Diluted earnings per share (cents per share) 5.05 20.30 5.59 9.07<strong>Macquarie</strong> <strong>International</strong> <strong>Infrastructure</strong> <strong>Fund</strong> <strong>Limited</strong> Page 5