PDF file (2.44 MB) - Asia Pacific Adaptation Network
PDF file (2.44 MB) - Asia Pacific Adaptation Network
PDF file (2.44 MB) - Asia Pacific Adaptation Network
You also want an ePaper? Increase the reach of your titles
YUMPU automatically turns print PDFs into web optimized ePapers that Google loves.
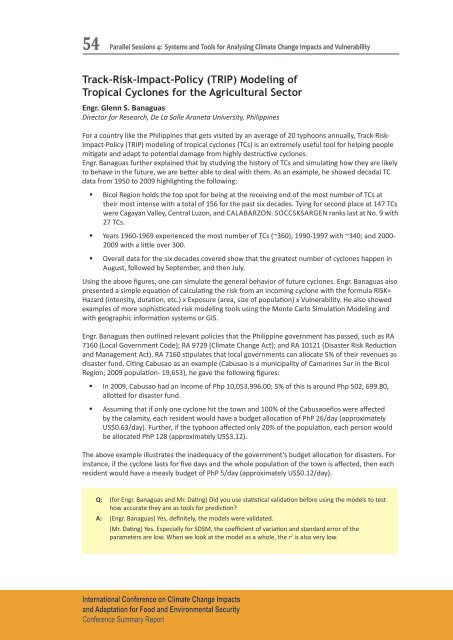
54Parallel Sessions 4: Systems and Tools for Analysing Climate Change Impacts and VulnerabilityTrack-Risk-Impact-Policy (TRIP) Modeling ofTropical Cyclones for the Agricultural SectorEngr. Glenn S. BanaguasDirector for Research, De La Salle Araneta University, PhilippinesFor a country like the Philippines that gets visited by an average of 20 typhoons annually, Track-Risk-Impact-Policy (TRIP) modeling of tropical cyclones (TCs) is an extremely useful tool for helping peoplemitigate and adapt to potential damage from highly destructive cyclones.Engr. Banaguas further explained that by studying the history of TCs and simulating how they are likelyto behave in the future, we are better able to deal with them. As an example, he showed decadal TCdata from 1950 to 2009 highlighting the following:• Bicol Region holds the top spot for being at the receiving end of the most number of TCs attheir most intense with a total of 156 for the past six decades. Tying for second place at 147 TCswere Cagayan Valley, Central Luzon, and CALABARZON. SOCCSKSARGEN ranks last at No. 9 with27 TCs.• Years 1960-1969 experienced the most number of TCs (~360); 1990-1997 with ~340; and 2000-2009 with a little over 300.• Overall data for the six decades covered show that the greatest number of cyclones happen inAugust, followed by September, and then July.Using the above figures, one can simulate the general behavior of future cyclones. Engr. Banaguas alsopresented a simple equation of calculating the risk from an incoming cyclone with the formula RISK=Hazard (intensity, duration, etc.) x Exposure (area, size of population) x Vulnerability. He also showedexamples of more sophisticated risk modeling tools using the Monte Carlo Simulation Modeling andwith geographic information systems or GIS.Engr. Banaguas then outlined relevant policies that the Philippine government has passed, such as RA7160 (Local Government Code); RA 9729 (Climate Change Act); and RA 10121 (Disaster Risk Reductionand Management Act). RA 7160 stipulates that local governments can allocate 5% of their revenues asdisaster fund. Citing Cabusao as an example (Cabusao is a municipality of Camarines Sur in the BicolRegion; 2009 population- 19,653), he gave the following figures:• In 2009, Cabusao had an income of Php 10,053,996.00; 5% of this is around Php 502, 699.80,allotted for disaster fund.• Assuming that if only one cyclone hit the town and 100% of the Cabusaoeños were affectedby the calamity, each resident would have a budget allocation of PhP 26/day (approximatelyUS$0.63/day). Further, if the typhoon affected only 20% of the population, each person wouldbe allocated PhP 128 (approximately US$3.12).The above example illustrates the inadequacy of the government’s budget allocation for disasters. Forinstance, if the cyclone lasts for five days and the whole population of the town is affected, then eachresident would have a measly budget of PhP 5/day (approximately US$0.12/day).Q: (for Engr. Banaguas and Mr. Dating) Did you use statistical validation before using the models to testhow accurate they are as tools for prediction?A: (Engr. Banaguas) Yes, definitely, the models were validated.(Mr. Dating) Yes. Especially for SDSM, the coefficient of variation and standard error of theparameters are low. When we look at the model as a whole, the r 2 is also very low.International Conference on Climate Change Impactsand <strong>Adaptation</strong> for Food and Environmental SecurityConference Summary Report


