UNHCR Statistical Yearbook 2010 61
UNHCR Statistical Yearbook 2010 61
UNHCR Statistical Yearbook 2010 61
- No tags were found...

You also want an ePaper? Increase the reach of your titles
YUMPU automatically turns print PDFs into web optimized ePapers that Google loves.
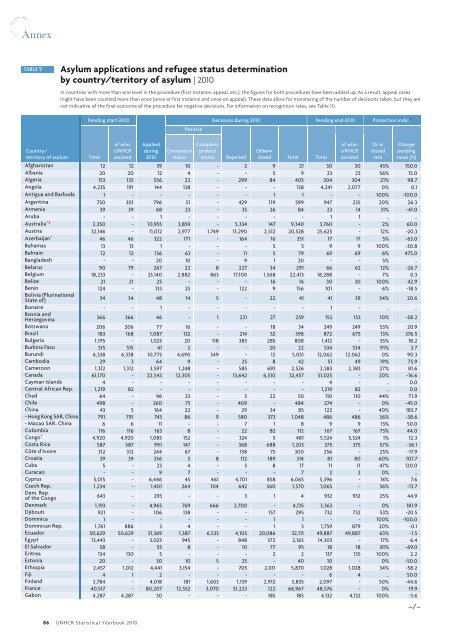
AnnexTABLE 9Asylum applications and refugee status determinationby country/territory of asylum | <strong>2010</strong>In countries with more than one level in the procedure (first instance, appeal, etc.), the figures for both procedures have been added up. As a result, appeal casesmight have been counted more than once (once at first instance and once on appeal). These data allow for monitoring of the number of decisions taken, but they arenot indicative of the final outcome of the procedure for negative decisions. For information on recognition rates, see Table 10.Pending start-<strong>2010</strong>PositiveDecisions during <strong>2010</strong> Pending end-<strong>2010</strong> Protection indic. 1Country/territory of asylumTotalof who:<strong>UNHCR</strong>assistedAppliedduring<strong>2010</strong>ConventionstatusComplem.protectstatusRejectedOtherw.closed Total Totalof who:<strong>UNHCR</strong>assistedO/wclosedrateChangependingcases (%)Afghanistan 12 12 39 10 - 2 9 21 30 30 43% 150.0Albania 20 20 12 4 - - 5 9 23 23 56% 15.0Algeria 153 135 556 22 - 299 84 405 304 304 21% 98.7Angola 4,235 191 144 138 - - - 138 4,241 2,077 0% 0.1Antigua and Barbuda 1 - - - - - 1 1 - - 100% -100.0Argentina 750 301 796 51 - 429 119 599 947 235 20% 26.3Armenia 39 39 68 23 - 35 26 84 23 14 31% -41.0Aruba - - 1 - - - - - 1 1 .. ..Australia * 2 2,350 - 10,955 3,859 - 5,334 147 9,340 3,760 - 2% 60.0Austria 32,146 - 11,012 2,977 1,749 13,290 2,512 20,528 25,625 - 12% -20.3Azerbaijan * 46 46 322 171 - 164 16 351 17 17 5% -63.0Bahamas 13 13 1 - - - 5 5 9 9 100% -30.8Bahrain 12 12 136 63 - 11 5 79 69 69 6% 475.0Bangladesh - - 20 10 - 9 1 20 - - 5% ..Belarus 90 79 267 22 8 227 34 291 66 62 12% -26.7Belgium 18,233 - 33,140 2,882 863 17,100 1,568 22,413 18,288 - 7% 0.3Belize 21 21 25 - - - 16 16 30 30 100% 42.9Benin 124 - 133 25 - 122 9 156 101 - 6% -18.5Bolivia (PlurinationalState of) 34 34 48 14 5 - 22 41 41 39 54% 20.6Bonaire - - 1 - - - - - 1 - .. ..Bosnia andHerzegovina 366 366 46 - 1 231 27 259 153 153 10% -58.2Botswana 206 206 77 16 - - 18 34 249 249 53% 20.9Brazil 183 168 1,087 132 - 214 52 398 872 675 13% 376.5Bulgaria 1,195 - 1,025 20 118 385 285 808 1,412 - 35% 18.2Burkina Faso 515 515 41 2 - - 20 22 534 534 91% 3.7Burundi 6,338 6,338 10,775 4,690 349 - 12 5,051 12,062 12,062 0% 90.3Cambodia 29 3 64 9 - 25 8 42 51 49 19% 75.9Cameroon 1,312 1,312 3,597 1,248 - 585 693 2,526 2,383 2,383 27% 81.6Canada <strong>61</strong>,170 - 22,543 12,305 - 13,642 6,510 32,457 51,025 - 20% -16.6Cayman Islands 4 - - - - - - - 4 - .. 0.0Central African Rep. 1,219 82 - - - - - - 1,219 82 .. 0.0Chad 64 - 96 23 - 5 22 50 110 110 44% 71.9Chile 498 - 260 75 - 409 - 484 274 - 0% -45.0China 43 5 164 22 - 29 34 85 122 - 40% 183.7- Hong Kong SAR, China 791 791 743 86 9 580 373 1,048 486 486 36% -38.6- Macao SAR, China 6 6 11 - - 7 1 8 9 9 13% 50.0Colombia 116 116 163 8 - 22 82 112 167 167 73% 44.0Congo * 4,920 4,920 1,085 152 - 324 5 481 5,524 5,524 1% 12.3Costa Rica 587 587 991 147 - 368 688 1,203 375 375 57% -36.1Côte d’Ivoire 312 312 244 67 - 158 75 300 256 - 25% -17.9Croatia 39 39 356 5 8 112 189 314 81 80 60% 107.7Cuba 5 - 23 4 - 5 8 17 11 11 47% 120.0Curacao - - 9 7 - - - 7 2 2 0% ..Cyprus 5,015 - 6,446 45 4<strong>61</strong> 4,701 858 6,065 5,396 - 14% 7.6Czech Rep. 1,234 - 1,401 264 104 642 560 1,570 1,065 - 36% -13.7Dem. Rep.of the Congo 643 - 293 - - 3 1 4 932 932 25% 44.9Denmark 1,193 - 4,965 769 666 2,700 - 4,135 3,363 - 0% 181.9Djibouti 921 - 106 138 - - 157 295 732 732 53% -20.5Dominica 1 - - - - - 1 1 - - 100% -100.0Dominican Rep. 1,7<strong>61</strong> 886 3 4 - - 1 5 1,759 879 20% -0.1Ecuador 50,629 50,629 31,369 1,387 6,533 4,105 20,086 32,111 49,887 49,887 63% -1.5Egypt 13,443 - 3,025 945 - 848 372 2,165 14,303 - 17% 6.4El Salvador 58 - 55 8 - 10 77 95 18 18 81% -69.0Eritrea 134 130 5 - - - 2 2 137 135 100% 2.2Estonia 20 - 30 10 5 25 - 40 10 - 0% -50.0Ethiopia 2,457 1,012 4,441 3,154 - 705 2,011 5,870 1,028 1,028 34% -58.2Fiji 4 1 2 - - - - - 6 4 .. 50.0Finland 3,784 - 4,018 181 1,603 1,139 2,912 5,835 2,097 - 50% -44.6France 40,517 - 80,207 12,552 3,070 51,223 122 66,967 48,576 - 0% 19.9Gabon 4,287 4,287 30 - - - 185 185 4,132 4,132 100% -3.6...⁄ ...86 <strong>UNHCR</strong> <strong>Statistical</strong> <strong>Yearbook</strong> <strong>2010</strong>