UNHCR Statistical Yearbook 2010 61
UNHCR Statistical Yearbook 2010 61
UNHCR Statistical Yearbook 2010 61
- No tags were found...

You also want an ePaper? Increase the reach of your titles
YUMPU automatically turns print PDFs into web optimized ePapers that Google loves.
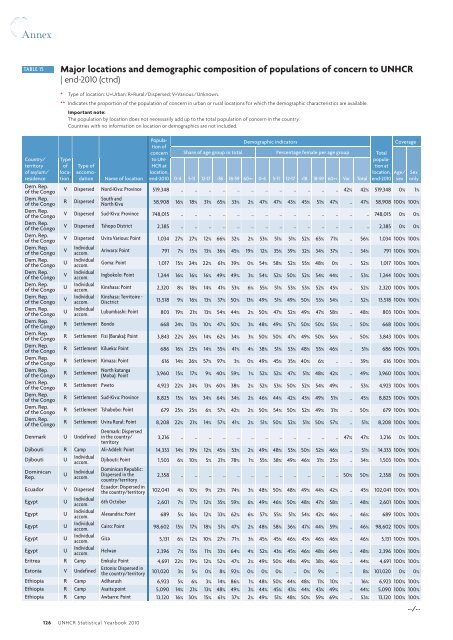
AnnexTABLE 15Major locations and demographic composition of populations of concern to <strong>UNHCR</strong>| end-<strong>2010</strong> (ctnd)Country/territoryof asylum/residenceDem. Rep.of the CongoDem. Rep.of the CongoDem. Rep.of the CongoDem. Rep.of the CongoDem. Rep.of the CongoDem. Rep.of the CongoDem. Rep.of the CongoDem. Rep.of the CongoDem. Rep.of the CongoDem. Rep.of the CongoDem. Rep.of the CongoDem. Rep.of the CongoDem. Rep.of the CongoDem. Rep.of the CongoDem. Rep.of the CongoDem. Rep.of the CongoDem. Rep.of the CongoDem. Rep.of the CongoDem. Rep.of the CongoDem. Rep.of the CongoTypeoflocation1Name of location126 <strong>UNHCR</strong> <strong>Statistical</strong> <strong>Yearbook</strong> <strong>2010</strong>Type ofaccomodationPopulationofconcernto UN-HCR atlocation,end-<strong>2010</strong>Share of age group in totalDemographic indicatorsPercentage female per age group0-4 5-11 12-17 0-4 5-11 12-17 Var. TotalTotalpopulationatlocation,end-<strong>2010</strong>Coverage *V Dispersed Nord-Kivu: Province 519,348 .. .. .. .. .. .. .. .. .. .. .. .. 42% 42% 519,348 0% 1%RDispersedSouth andNorth Kivu 58,908 16% 18% 31% 65% 33% 2% 47% 47% 43% 45% 51% 47% .. 47% 58,908 100% 100%V Dispersed Sud-Kivu: Province 748,015 .. .. .. .. .. .. .. .. .. .. .. .. .. .. 748,015 0% 0%V Dispersed Tshopo District 2,385 .. .. .. .. .. .. .. .. .. .. .. .. .. .. 2,385 0% 0%V Dispersed Uvira Various: Point 1,034 27% 27% 12% 66% 32% 2% 53% 51% 51% 52% 65% 71% .. 56% 1,034 100% 100%VUVUVUIndividualaccom.Individualaccom.Individualaccom.Individualaccom.Individualaccom.Individualaccom.Ariwara: Point 791 7% 15% 13% 36% 45% 19% 12% 35% 39% 32% 34% 37% .. 34% 791 100% 100%Goma: Point 1,017 15% 24% 22% <strong>61</strong>% 39% 0% 54% 58% 52% 55% 48% 0% .. 52% 1,017 100% 100%Ingbokolo: Point 1,244 16% 16% 16% 49% 49% 3% 54% 52% 50% 52% 54% 44% .. 53% 1,244 100% 100%Kinshasa: Point 2,320 8% 18% 14% 41% 53% 6% 55% 51% 53% 53% 52% 45% .. 52% 2,320 100% 100%Kinshasa: Territoire -Disctrict 13,518 9% 16% 13% 37% 50% 13% 49% 51% 49% 50% 53% 54% .. 52% 13,518 100% 100%Lubumbashi: Point 803 19% 21% 13% 54% 44% 2% 50% 47% 52% 49% 47% 58% .. 48% 803 100% 100%R Settlement Bondo 668 24% 13% 10% 47% 50% 3% 48% 49% 57% 50% 50% 55% .. 50% 668 100% 100%R Settlement Fizi (Baraka): Point 3,843 22% 26% 14% 62% 34% 3% 50% 50% 47% 49% 50% 56% .. 50% 3,843 100% 100%R Settlement Kilueka: Point 686 16% 25% 14% 55% 41% 4% 38% 51% 53% 48% 55% 46% .. 51% 686 100% 100%R Settlement Kimaza: Point <strong>61</strong>6 14% 26% 57% 97% 3% 0% 49% 45% 35% 40% 6% .. .. 39% <strong>61</strong>6 100% 100%RSettlementDenmark U UndefinedNorth katanga(Moba): Point 3,960 15% 17% 9% 40% 59% 1% 52% 52% 47% 51% 48% 42% .. 49% 3,960 100% 100%R Settlement Pweto 4,923 22% 24% 13% 60% 38% 2% 52% 53% 50% 52% 54% 49% .. 53% 4,923 100% 100%R Settlement Sud-Kivu: Province 8,825 15% 16% 34% 64% 34% 2% 46% 44% 42% 43% 49% 51% .. 45% 8,825 100% 100%R Settlement Tshabobo: Point 679 25% 25% 6% 57% 42% 2% 50% 54% 50% 52% 49% 31% .. 50% 679 100% 100%R Settlement Uvira Rural: Point 8,208 22% 21% 14% 57% 41% 2% 51% 50% 52% 51% 50% 57% .. 51% 8,208 100% 100%Denmark: Dispersedin the country/territory3,216 .. .. .. .. .. .. .. .. .. .. .. .. 47% 47% 3,216 0% 100%Djibouti R Camp Ali-Addeh: Point 14,333 14% 19% 12% 45% 53% 2% 49% 48% 53% 50% 52% 46% .. 51% 14,333 100% 100%Djibouti U Individualaccom.Djibouti: Point 1,503 6% 10% 5% 21% 78% 1% 55% 38% 49% 46% 31% 25% .. 34% 1,503 100% 100%DominicanRep.UIndividualaccom.Ecuador V Dispersed* Type of location: U=Urban; R=Rural/Dispersed; V=Various/Unknown.** Indicates the proportion of the population of concern in urban or rural locations for which the demographic characteristics are available.Important note:The population by location does not necessarily add up to the total population of concern in the country.Countries with no information on location or demographics are not included.Dominican Republic:Dispersed in thecountry/territory2,358 .. .. .. .. .. .. .. .. .. .. .. .. 50% 50% 2,358 0% 100%Ecuador: Dispersed inthe country/territory 102,041 4% 10% 9% 23% 74% 3% 48% 50% 48% 49% 44% 42% .. 45% 102,041 100% 100%Egypt U Individualaccom.6th October 2,601 7% 17% 12% 35% 59% 6% 49% 46% 50% 48% 47% 58% .. 48% 2,601 100% 100%Egypt U Individualaccom.Alexandria: Point 689 5% 16% 12% 33% 62% 6% 57% 55% 51% 54% 42% 46% .. 46% 689 100% 100%Egypt U Individualaccom.Cairo: Point 98,602 15% 17% 18% 51% 47% 2% 48% 58% 36% 47% 44% 59% .. 46% 98,602 100% 100%Egypt U Individualaccom.Giza 5,131 6% 12% 10% 27% 71% 3% 45% 45% 46% 45% 46% 46% .. 46% 5,131 100% 100%Egypt U Individualaccom.Helwan 2,396 7% 15% 11% 33% 64% 4% 52% 43% 45% 46% 48% 64% .. 48% 2,396 100% 100%Eritrea R Camp Emkulu: Point 4,691 22% 19% 12% 52% 47% 2% 49% 50% 48% 49% 38% 46% .. 44% 4,691 100% 100%Estonia V UndefinedEstonia: Dispersed inthe country/territory 101,020 3% 5% 0% 8% 92% 0% 0% 0% .. 0% 9% .. .. 8% 101,020 0% 0%Ethiopia R Camp Adiharush 6,923 5% 6% 3% 14% 86% 1% 48% 50% 44% 48% 11% 10% .. 16% 6,923 100% 100%Ethiopia R Camp Asaita:point 5,090 14% 21% 13% 48% 49% 3% 44% 45% 43% 44% 43% 49% .. 44% 5,090 100% 100%Ethiopia R Camp Awbarre: Point 13,120 16% 30% 15% <strong>61</strong>% 37% 2% 49% 51% 48% 50% 59% 69% .. 53% 13,120 100% 100%...⁄ ...Age/sexSexonly