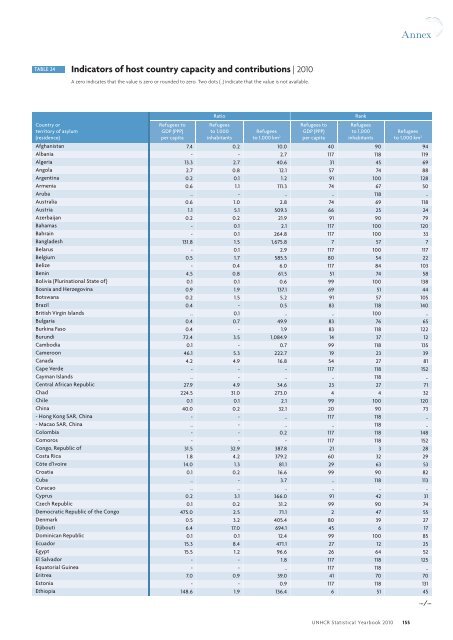
AnnexTABLE 23Refugees, asylum-seekers, internally displaced persons (IDPs),returnees (refugees and IDPs), stateless persons, and others of concern to <strong>UNHCR</strong>| 2000-<strong>2010</strong>See Table 1 for definition of population categories.Due to change in classification and estimation methodology in a number of countries, figures as from 2007 are not fully comparable with pre-2007 figures.Absolute valuesEnd of year Refugees 1 (pending cases)Asylum-seekersReturnedrefugeesIDPs protected/assisted 2ReturnedIDPsStatelesspersons 3Others ofconcern 32000 12,129,600 1,087,500 767,500 5,998,500 369,100 .. 1,653,900 22,006,1002001 12,116,800 1,072,700 462,400 5,096,500 241,000 .. 1,039,500 20,028,9002002 10,594,100 1,093,500 2,426,000 4,646,600 1,179,000 .. 953,300 20,892,5002003 9,592,800 997,600 1,094,900 4,181,700 237,800 .. 905,300 17,010,1002004 9,574,800 885,200 1,434,400 5,426,500 146,500 1,455,900 597,000 19,520,3002005 8,662,000 802,100 1,105,600 6,<strong>61</strong>6,800 519,400 2,383,700 960,400 21,050,0002006 9,877,700 743,900 733,700 12,794,300 1,864,200 5,806,000 1,045,500 32,865,3002007 11,391,000 740,100 730,600 13,740,200 2,070,100 2,937,300 68,700 31,678,0002008 10,489,800 825,800 603,800 14,442,200 1,3<strong>61</strong>,400 6,572,200 166,900 34,462,1002009 10,396,500 983,900 251,500 15,628,100 2,229,500 6,559,600 411,700 36,460,800<strong>2010</strong> 10,549,700 837,500 197,700 14,697,900 2,923,300 3,463,000 1,255,600 33,924,700TotalDistribution by categoryEnd of year Refugees 1 (pending cases) refugeesassisted 2IDPspersons 3 concern 3TotalAsylum-seekers Returned IDPs protected/ Returned Stateless Others of2000 55.1% 4.9% 3.5% 27.3% 1.7% .. 7.5% 100.0%2001 60.5% 5.4% 2.3% 25.4% 1.2% .. 5.2% 100.0%2002 50.7% 5.2% 11.6% 22.2% 5.6% .. 4.6% 99.9%2003 56.4% 5.9% 6.4% 24.6% 1.4% .. 5.3% 100.0%2004 49.1% 4.5% 7.3% 27.8% 0.8% 7.5% 3.1% 100.1%2005 41.1% 3.8% 5.3% 31.4% 2.5% 11.3% 4.6% 100.0%2006 30.1% 2.3% 2.2% 38.9% 5.7% 17.7% 3.2% 100.1%2007 36.0% 2.3% 2.3% 43.4% 6.5% 9.3% 0.2% 100.0%2008 30.4% 2.4% 1.8% 41.9% 4.0% 19.1% 0.5% 100.1%2009 28.5% 2.7% 0.7% 42.9% 6.1% 18.0% 1.1% 100.0%<strong>2010</strong> 31.1% 2.5% 0.6% 43.3% 8.6% 10.2% 3.7% 100.0%Annual changeEnd of year Refugees 1 (pending cases) refugeesassisted 2IDPspersons 3 concern 3TotalAsylum-seekers Returned IDPs protected/ Returned Stateless Others of2000-2001 -0.1% -1.4% -39.8% -15.0% -34.7% .. -37.1% -9.0%2001-2002 -12.6% 1.9% 424.7% -8.8% 389.2% .. -8.3% 4.3%2002-2003 -9.5% -8.8% -54.9% -10.0% -79.8% .. -5.0% -18.6%2003-2004 -0.2% -11.3% 31.0% 29.8% -38.4% .. -34.1% 14.8%2004-2005 -9.5% -9.4% -22.9% 21.9% 254.5% 63.7% 60.9% 7.8%2005-2006 14.0% -7.3% -33.6% 93.4% 258.9% 143.6% 8.9% 56.1%2006-2007 15.3% -0.5% -0.4% 7.4% 11.0% -49.4% -93.4% -3.6%2007-2008 -7.9% 11.6% -17.4% 5.1% -34.2% 123.7% 142.9% 8.8%2008-2009 -0.9% 19.1% -58.3% 8.2% 63.8% -0.2% 146.7% 5.8%2009-<strong>2010</strong> 1.5% -14.9% -21.4% -6.0% 31.1% -47.2% 205.0% -7.0%Notes1 Since 2007, people in refugee-like situations are included in the refugee estimates. Figures as from 2007 are not fully comparable with previous years.2 Since 2007, people in IDP-like situations are included in the IDP estimates. IDP figures since 2007 are not fully comparable with previous years.3 Stateless persons were included in the category “Others of concern” until 2003.154 <strong>UNHCR</strong> <strong>Statistical</strong> <strong>Yearbook</strong> <strong>2010</strong>
AnnexTABLE 24 Indicators of host country capacity and contributions | <strong>2010</strong>A zero indicates that the value is zero or rounded to zero. Two dots (..) indicate that the value is not available.Country orterritory of asylum(residence)Refugees toGDP (PPP)per capitaRatioRefugeesto 1,000inhabitantsRefugeesto 1,000 km 2Refugees toGDP (PPP)per capitaRankRefugeesto 1,000inhabitantsRefugeesto 1,000 km 2Afghanistan 7.4 0.2 10.0 40 90 94Albania - - 2.7 117 118 119Algeria 13.3 2.7 40.6 31 45 69Angola 2.7 0.8 12.1 57 74 88Argentina 0.2 0.1 1.2 91 100 128Armenia 0.6 1.1 111.3 74 67 50Aruba .. - .. .. 118 ..Australia 0.6 1.0 2.8 74 69 118Austria 1.1 5.1 509.3 66 25 24Azerbaijan 0.2 0.2 21.9 91 90 79Bahamas - 0.1 2.1 117 100 120Bahrain - 0.1 264.8 117 100 33Bangladesh 131.8 1.5 1,675.8 7 57 7Belarus - 0.1 2.9 117 100 117Belgium 0.5 1.7 585.5 80 54 22Belize - 0.4 6.0 117 84 103Benin 4.5 0.8 <strong>61</strong>.5 51 74 58Bolivia (Plurinational State of) 0.1 0.1 0.6 99 100 138Bosnia and Herzegovina 0.9 1.9 137.1 69 51 44Botswana 0.2 1.5 5.2 91 57 105Brazil 0.4 - 0.5 83 118 140British Virgin Islands .. 0.1 .. .. 100 ..Bulgaria 0.4 0.7 49.9 83 76 65Burkina Faso 0.4 - 1.9 83 118 122Burundi 72.4 3.5 1,084.9 14 37 12Cambodia 0.1 - 0.7 99 118 135Cameroon 46.1 5.3 222.7 19 23 39Canada 4.2 4.9 16.8 54 27 81Cape Verde - - - 117 118 152Cayman Islands .. - .. .. 118 ..Central African Republic 27.9 4.9 34.6 23 27 71Chad 224.5 31.0 273.0 4 4 32Chile 0.1 0.1 2.1 99 100 120China 40.0 0.2 32.1 20 90 73- Hong Kong SAR, China - - .. 117 118 ..- Macao SAR, China .. - .. .. 118 ..Colombia - - 0.2 117 118 148Comoros - - - 117 118 152Congo, Republic of 31.5 32.9 387.8 21 3 28Costa Rica 1.8 4.2 379.2 60 32 29Côte d’Ivoire 14.0 1.3 81.1 29 63 53Croatia 0.1 0.2 16.6 99 90 82Cuba .. - 3.7 .. 118 113Curacao .. .. .. .. .. ..Cyprus 0.2 3.1 366.0 91 42 31Czech Republic 0.1 0.2 31.2 99 90 74Democratic Republic of the Congo 475.0 2.5 71.1 2 47 55Denmark 0.5 3.2 405.4 80 39 27Djibouti 6.4 17.0 694.1 45 6 17Dominican Republic 0.1 0.1 12.4 99 100 85Ecuador 15.3 8.4 471.1 27 12 25Egypt 15.5 1.2 96.6 26 64 52El Salvador - - 1.8 117 118 125Equatorial Guinea - - .. 117 118 ..Eritrea 7.0 0.9 39.0 41 70 70Estonia - - 0.9 117 118 131Ethiopia 148.6 1.9 136.4 6 51 45...⁄ ...<strong>UNHCR</strong> <strong>Statistical</strong> <strong>Yearbook</strong> <strong>2010</strong> 155