UNHCR Statistical Yearbook 2010 61
UNHCR Statistical Yearbook 2010 61
UNHCR Statistical Yearbook 2010 61
- No tags were found...

Create successful ePaper yourself
Turn your PDF publications into a flip-book with our unique Google optimized e-Paper software.
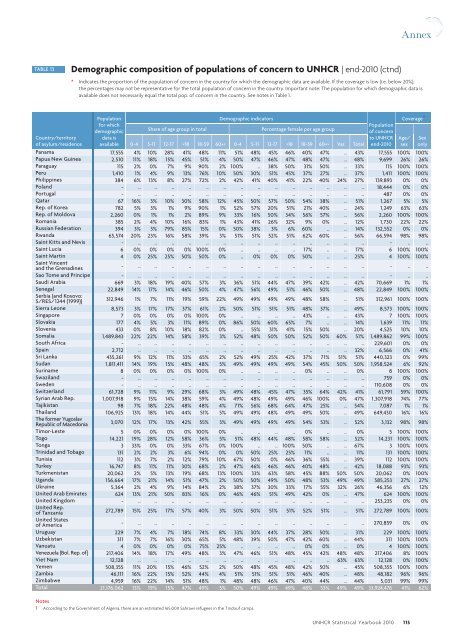
AnnexTABLE 13Demographic composition of populations of concern to <strong>UNHCR</strong> | end-<strong>2010</strong> (ctnd)* Indicates the proportion of the population of concern in the country for which the demographic data are available. If the coverage is low (i.e. below 20%),the percentages may not be representative for the total population of concern in the country. Important note: The population for which demographic data isavailable does not necessarily equal the total pop. of concern in the country. See notes in Table 1.Country/territoryof asylum/residencePopulationfor whichdemographicdata isavailableShare of age group in totalDemographic indicatorsPercentage female per age group0-4 5-11 12-17 0-4 5-11 12-17 Var. TotalPopulationof concernto <strong>UNHCR</strong>end-<strong>2010</strong>Coverage *Panama 17,555 4% 10% 28% 41% 48% 11% 51% 48% 45% 46% 40% 47% .. 43% 17,555 100% 100%Papua New Guinea 2,510 11% 18% 15% 45% 51% 4% 50% 47% 46% 47% 48% 47% .. 48% 9,699 26% 26%Paraguay 115 2% 0% 7% 9% 90% 2% 100% .. 38% 50% 31% 50% .. 33% 115 100% 100%Peru 1,410 1% 4% 9% 13% 76% 10% 50% 30% 51% 45% 37% 27% .. 37% 1,411 100% 100%Philippines 384 6% 13% 8% 27% 72% 2% 42% 41% 40% 41% 22% 40% 24% 27% 139,893 0% 0%Poland - .. .. .. .. .. .. .. .. .. .. .. .. .. .. 18,444 0% 0%Portugal - .. .. .. .. .. .. .. .. .. .. .. .. .. .. 487 0% 0%Qatar 67 16% 3% 10% 30% 58% 12% 45% 50% 57% 50% 54% 38% .. 51% 1,267 5% 5%Rep. of Korea 782 5% 3% 1% 9% 90% 1% 52% 57% 20% 51% 21% 40% .. 24% 1,249 63% 63%Rep. of Moldova 2,260 0% 1% 1% 2% 89% 9% 33% 16% 50% 34% 56% 57% .. 56% 2,260 100% 100%Romania 385 2% 4% 10% 16% 83% 1% 43% 41% 26% 32% 9% 0% .. 12% 1,730 22% 22%Russian Federation 394 3% 3% 79% 85% 15% 0% 50% 38% 3% 6% 60% .. .. 14% 132,552 0% 0%Rwanda 65,574 20% 23% 16% 58% 39% 3% 51% 51% 52% 51% 62% 60% .. 56% 66,594 98% 98%Saint Kitts and Nevis - .. .. .. .. .. .. .. .. .. .. .. .. .. .. - .. ..Saint Lucia 6 0% 0% 0% 0% 100% 0% .. .. .. .. 17% .. .. 17% 6 100% 100%Saint Martin 4 0% 25% 25% 50% 50% 0% .. 0% 0% 0% 50% .. .. 25% 4 100% 100%Saint Vincentand the Grenadines - .. .. .. .. .. .. .. .. .. .. .. .. .. .. - .. ..Sao Tome and Principe - .. .. .. .. .. .. .. .. .. .. .. .. .. .. - .. ..Saudi Arabia 669 3% 18% 19% 40% 57% 3% 36% 51% 44% 47% 39% 42% .. 42% 70,669 1% 1%Senegal 22,849 14% 17% 14% 46% 50% 4% 47% 56% 49% 51% 46% 50% .. 48% 22,849 100% 100%Serbia (and Kosovo:S/RES/1244 (1999)) 312,946 1% 7% 11% 19% 59% 22% 49% 49% 49% 49% 48% 58% .. 51% 312,9<strong>61</strong> 100% 100%Sierra Leone 8,573 3% 17% 17% 37% <strong>61</strong>% 2% 50% 51% 51% 51% 48% 37% .. 49% 8,573 100% 100%Singapore 7 0% 0% 0% 0% 100% 0% .. .. .. .. 43% .. .. 43% 7 100% 100%Slovakia 177 4% 5% 3% 11% 89% 0% 86% 50% 60% 65% 7% .. .. 14% 1,639 11% 11%Slovenia 433 0% 8% 10% 18% 82% 0% .. 55% 31% 41% 15% 50% .. 20% 4,525 10% 10%Somalia 1,489,843 22% 22% 14% 58% 39% 3% 52% 48% 50% 50% 52% 50% 60% 51% 1,489,862 99% 100%South Africa - .. .. .. .. .. .. .. .. .. .. .. .. .. .. 229,601 0% 0%Spain 2,712 .. .. .. .. .. .. .. .. .. .. .. .. .. 32% 6,566 0% 41%Sri Lanka 435,2<strong>61</strong> 9% 12% 11% 33% 65% 2% 52% 49% 25% 42% 37% 71% 51% 51% 440,323 0% 99%Sudan 1,811,411 14% 19% 15% 48% 48% 5% 49% 49% 49% 49% 54% 45% 50% 50% 1,958,524 6% 92%Suriname 8 0% 0% 0% 0% 100% 0% .. .. .. .. 0% .. .. 0% 8 100% 100%Swaziland - .. .. .. .. .. .. .. .. .. .. .. .. .. .. 759 0% 0%Sweden - .. .. .. .. .. .. .. .. .. .. .. .. .. .. 110,608 0% 0%Switzerland <strong>61</strong>,728 9% 11% 9% 29% 68% 3% 49% 48% 45% 47% 35% 64% 42% 41% <strong>61</strong>,791 59% 100%Syrian Arab Rep. 1,007,918 9% 15% 14% 38% 59% 4% 49% 48% 49% 49% 46% 100% 0% 47% 1,307,918 74% 77%Tajikistan 98 7% 18% 22% 48% 48% 4% 71% 56% 68% 64% 47% 25% .. 54% 7,087 1% 1%Thailand 106,925 13% 18% 14% 44% 51% 5% 49% 49% 48% 49% 49% 50% .. 49% 649,430 16% 16%The former YugoslavRepublic of Macedonia 3,070 12% 17% 13% 42% 55% 3% 49% 49% 49% 49% 54% 53% .. 52% 3,132 98% 98%Timor-Leste 5 0% 0% 0% 0% 100% 0% .. .. .. .. 0% .. .. 0% 5 100% 100%Togo 14,221 19% 28% 12% 58% 36% 5% 51% 48% 44% 48% 58% 58% .. 52% 14,231 100% 100%Tonga 3 33% 0% 0% 33% 67% 0% 100% .. .. 100% 50% .. .. 67% 3 100% 100%Trinidad and Tobago 131 2% 2% 3% 6% 94% 0% 0% 50% 25% 25% 11% .. .. 11% 131 100% 100%Tunisia 112 3% 7% 2% 12% 79% 10% 67% 50% 0% 46% 36% 55% .. 39% 112 100% 100%Turkey 16,747 8% 11% 11% 30% 68% 2% 47% 46% 46% 46% 40% 48% .. 42% 18,088 93% 93%Turkmenistan 20,062 2% 5% 13% 19% 68% 13% 100% 33% 63% 58% 45% 88% 50% 50% 20,062 0% 100%Uganda 156,664 17% 21% 14% 51% 47% 2% 50% 50% 49% 50% 48% 53% 49% 49% 585,253 27% 27%Ukraine 5,364 2% 4% 9% 14% 84% 2% 38% 37% 30% 33% 17% 55% 32% 26% 46,356 6% 12%United Arab Emirates 624 13% 21% 50% 83% 16% 0% 46% 46% 51% 49% 42% 0% .. 47% 624 100% 100%United Kingdom - .. .. .. .. .. .. .. .. .. .. .. .. .. .. 253,235 0% 0%United Rep.of Tanzania 272,789 15% 25% 17% 57% 40% 3% 50% 50% 51% 51% 52% 51% .. 51% 272,789 100% 100%United Statesof America - .. .. .. .. .. .. .. .. .. .. .. .. .. .. 270,859 0% 0%Uruguay 229 7% 4% 7% 18% 74% 8% 33% 30% 44% 37% 28% 50% .. 31% 229 100% 100%Uzbekistan 311 7% 7% 16% 30% 65% 5% 48% 39% 50% 47% 42% 60% .. 44% 311 100% 100%Vanuatu 4 0% 0% 0% 0% 75% 25% .. .. .. .. 0% 0% .. 0% 4 100% 100%Venezuela (Bol. Rep. of) 217,406 14% 18% 17% 49% 48% 3% 47% 46% 51% 48% 45% 42% 48% 48% 217,406 8% 100%Viet Nam 12,128 .. .. .. .. .. .. .. .. .. .. .. .. 63% 63% 12,128 0% 100%Yemen 508,355 11% 20% 15% 46% 52% 2% 50% 48% 45% 48% 42% 50% .. 45% 508,355 100% 100%Zambia 46,111 16% 22% 15% 52% 44% 4% 51% 51% 51% 51% 46% 40% .. 48% 48,182 96% 96%Zimbabwe 4,959 16% 22% 14% 51% 48% 1% 48% 48% 46% 47% 40% 44% .. 44% 5,031 99% 99%Total 21,176,062 13% 19% 15% 47% 49% 5% 50% 49% 49% 49% 48% 53% 49% 49% 33,924,476 41% 62%Age/sexSexonlyNotes1 According to the Government of Algeria, there are an estimated 165,000 Sahrawi refugees in the Tindouf camps.<strong>UNHCR</strong> <strong>Statistical</strong> <strong>Yearbook</strong> <strong>2010</strong> 115