UNHCR Statistical Yearbook 2010 61
UNHCR Statistical Yearbook 2010 61
UNHCR Statistical Yearbook 2010 61
- No tags were found...

Create successful ePaper yourself
Turn your PDF publications into a flip-book with our unique Google optimized e-Paper software.
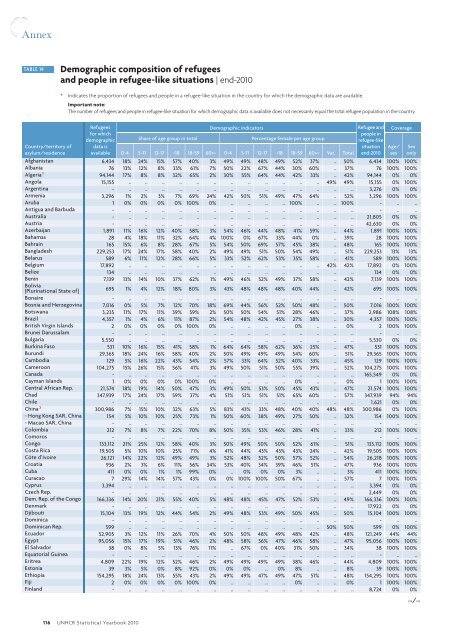
AnnexTABLE 14Demographic composition of refugeesand people in refugee-like situations | end-<strong>2010</strong>* Indicates the proportion of refugees and people in a refugee-like situation in the country for which the demographic data are available.Important note:The number of refugees and people in refugee-like situation for which demographic data is available does not necessarily equal the total refugee population in the country.Country/territory ofasylum/residenceRefugeesfor whichdemographicdata isavailableShare of age group in totalDemographic indicatorsPercentage female per age group0-4 5-11 12-17 0-4 5-11 12-17 Var. TotalRefugee andpeople inrefugee-likesituationend-<strong>2010</strong>Coverage *Afghanistan 6,434 18% 24% 15% 57% 40% 3% 49% 49% 48% 49% 52% 37% .. 50% 6,434 100% 100%Albania 76 13% 12% 8% 33% <strong>61</strong>% 7% 50% 22% 67% 44% 30% 60% .. 37% 76 100% 100%Algeria 1 94,144 17% 8% 8% 32% 65% 2% 30% 55% 64% 44% 42% 33% .. 42% 94,144 0% 0%Angola 15,155 .. .. .. .. .. .. .. .. .. .. .. .. 49% 49% 15,155 0% 100%Argentina - .. .. .. .. .. .. .. .. .. .. .. .. .. .. 3,276 0% 0%Armenia 3,296 1% 2% 3% 7% 69% 24% 42% 50% 51% 49% 47% 64% .. 52% 3,296 100% 100%Aruba 1 0% 0% 0% 0% 100% 0% .. .. .. .. 100% .. .. 100% - .. ..Antigua and Barbuda - .. .. .. .. .. .. .. .. .. .. .. .. .. .. - .. ..Australia - .. .. .. .. .. .. .. .. .. .. .. .. .. .. 21,805 0% 0%Austria - .. .. .. .. .. .. .. .. .. .. .. .. .. .. 42,630 0% 0%Azerbaijan 1,891 11% 16% 12% 40% 58% 3% 54% 46% 44% 48% 41% 59% .. 44% 1,891 100% 100%Bahamas 28 4% 18% 11% 32% 64% 4% 100% 0% 67% 33% 44% 0% .. 39% 28 100% 100%Bahrain 165 15% 6% 8% 28% 67% 5% 54% 50% 69% 57% 45% 38% .. 48% 165 100% 100%Bangladesh 229,253 17% 24% 17% 58% 40% 2% 49% 49% 51% 50% 54% 49% .. 51% 229,253 13% 13%Belarus 589 6% 11% 12% 28% 66% 5% 33% 52% 62% 53% 35% 58% .. 41% 589 100% 100%Belgium 17,892 .. .. .. .. .. .. .. .. .. .. .. .. 42% 42% 17,892 0% 100%Belize 134 .. .. .. .. .. .. .. .. .. .. .. .. .. .. 134 0% 0%Benin 7,139 13% 14% 10% 37% 62% 1% 49% 46% 52% 49% 37% 58% .. 42% 7,139 100% 100%Bolivia(Plurinational State of) 695 1% 4% 12% 18% 80% 3% 43% 48% 48% 48% 40% 44% .. 42% 695 100% 100%Bonaire - .. .. .. .. .. .. .. .. .. .. .. .. .. .. - .. ..Bosnia and Herzegovina 7,016 0% 5% 7% 12% 70% 18% 69% 44% 56% 52% 50% 48% .. 50% 7,016 100% 100%Botswana 3,235 11% 17% 11% 39% 59% 2% 50% 50% 54% 51% 28% 46% .. 37% 2,986 108% 108%Brazil 4,357 1% 4% 6% 11% 87% 2% 54% 48% 42% 45% 27% 38% .. 30% 4,357 100% 100%British Virgin Islands 2 0% 0% 0% 0% 100% 0% .. .. .. .. 0% .. .. 0% 2 100% 100%Brunei Darussalam - .. .. .. .. .. .. .. .. .. .. .. .. .. .. - .. ..Bulgaria 5,530 .. .. .. .. .. .. .. .. .. .. .. .. .. .. 5,530 0% 0%Burkina Faso 531 10% 16% 15% 41% 58% 1% 64% 64% 58% 62% 36% 25% .. 47% 531 100% 100%Burundi 29,365 18% 24% 16% 58% 40% 2% 50% 49% 49% 49% 54% 60% .. 51% 29,365 100% 100%Cambodia 129 5% 16% 22% 43% 54% 2% 57% 33% 64% 52% 40% 33% .. 45% 129 100% 100%Cameroon 104,275 15% 26% 15% 56% 41% 3% 49% 50% 51% 50% 55% 39% .. 52% 104,275 100% 100%Canada - .. .. .. .. .. .. .. .. .. .. .. .. .. .. 165,549 0% 0%Cayman Islands 1 0% 0% 0% 0% 100% 0% .. .. .. .. 0% .. .. 0% 1 100% 100%Central African Rep. 21,574 18% 19% 14% 50% 47% 3% 49% 50% 53% 50% 45% 43% .. 47% 21,574 100% 100%Chad 347,939 17% 24% 17% 59% 37% 4% 51% 51% 51% 51% 65% 60% .. 57% 347,939 94% 94%Chile - .. .. .. .. .. .. .. .. .. .. .. .. .. .. 1,621 0% 0%China 2 300,986 7% 15% 10% 32% 63% 5% 83% 43% 33% 48% 40% 40% 48% 48% 300,986 0% 100%- Hong Kong SAR, China 154 5% 10% 10% 25% 73% 1% 50% 60% 38% 49% 27% 50% .. 32% 154 100% 100%- Macao SAR, China - .. .. .. .. .. .. .. .. .. .. .. .. .. .. - .. ..Colombia 212 7% 8% 7% 22% 70% 8% 50% 35% 53% 46% 28% 41% .. 33% 212 100% 100%Comoros - .. .. .. .. .. .. .. .. .. .. .. .. .. .. - .. ..Congo 133,112 21% 25% 12% 58% 40% 3% 50% 49% 50% 50% 52% <strong>61</strong>% .. 51% 133,112 100% 100%Costa Rica 19,505 5% 10% 10% 25% 71% 4% 41% 44% 43% 43% 43% 24% .. 42% 19,505 100% 100%Côte d’Ivoire 26,121 14% 22% 12% 49% 49% 3% 52% 48% 52% 50% 57% 52% .. 54% 26,218 100% 100%Croatia 936 2% 3% 6% 11% 56% 34% 53% 40% 34% 39% 46% 51% .. 47% 936 100% 100%Cuba 411 0% 0% 1% 1% 99% 0% .. 0% 0% 0% 3% .. .. 3% 411 100% 100%Curacao 7 29% 14% 14% 57% 43% 0% 0% 100% 100% 50% 67% .. .. 57% 7 100% 100%Cyprus 3,394 .. .. .. .. .. .. .. .. .. .. .. .. .. .. 3,394 0% 0%Czech Rep. - .. .. .. .. .. .. .. .. .. .. .. .. .. .. 2,449 0% 0%Dem. Rep. of the Congo 166,336 14% 20% 21% 55% 40% 5% 48% 48% 45% 47% 52% 53% .. 49% 166,336 100% 100%Denmark - .. .. .. .. .. .. .. .. .. .. .. .. .. .. 17,922 0% 0%Djibouti 15,104 13% 19% 12% 44% 54% 2% 49% 48% 53% 49% 50% 45% .. 50% 15,104 100% 100%Dominica - .. .. .. .. .. .. .. .. .. .. .. .. .. .. - .. ..Dominican Rep. 599 .. .. .. .. .. .. .. .. .. .. .. .. 50% 50% 599 0% 100%Ecuador 52,905 3% 12% 11% 26% 70% 4% 50% 50% 48% 49% 48% 42% .. 48% 121,249 44% 44%Egypt 95,056 15% 17% 19% 51% 46% 2% 48% 58% 36% 47% 46% 58% .. 47% 95,056 100% 100%El Salvador 38 0% 8% 5% 13% 76% 11% .. 67% 0% 40% 31% 50% .. 34% 38 100% 100%Equatorial Guinea - .. .. .. .. .. .. .. .. .. .. .. .. .. .. - .. ..Eritrea 4,809 22% 19% 12% 52% 46% 2% 49% 49% 49% 49% 38% 46% .. 44% 4,809 100% 100%Estonia 39 3% 5% 0% 8% 92% 0% 0% 0% .. 0% 8% .. .. 8% 39 100% 100%Ethiopia 154,295 18% 24% 13% 55% 43% 2% 49% 49% 47% 49% 47% 51% .. 48% 154,295 100% 100%Fiji 2 0% 0% 0% 0% 100% 0% .. .. .. .. 0% .. .. 0% 1 100% 100%Finland - .. .. .. .. .. .. .. .. .. .. .. .. .. .. 8,724 0% 0%...⁄ ...Age/sexSexonly116 <strong>UNHCR</strong> <strong>Statistical</strong> <strong>Yearbook</strong> <strong>2010</strong>