Entire Annual Report - Anglo American Platinum
Entire Annual Report - Anglo American Platinum
Entire Annual Report - Anglo American Platinum
- No tags were found...

You also want an ePaper? Increase the reach of your titles
YUMPU automatically turns print PDFs into web optimized ePapers that Google loves.
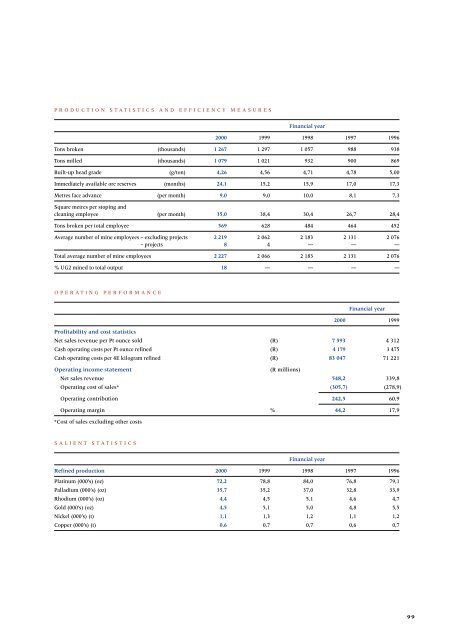
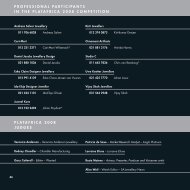
PRODUCTION STATISTICS AND EFFICIENCY MEASURESFinancial year2000 1999 1998 1997 1996Tons broken (thousands) 1 267 1 297 1 057 988 938Tons milled (thousands) 1 079 1 021 932 900 869Built-up head grade (g/ton) 4,26 4,56 4,71 4,78 5,00Immediately available ore reserves (months) 24,1 15,2 15,9 17,0 17,3Metres face advance (per month) 9,0 9,0 10,0 8,1 7,3Square metres per stoping andcleaning employee (per month) 35,0 38,4 30,4 26,7 28,4Tons broken per total employee 569 628 484 464 452Average number of mine employees – excluding projects 2 219 2 062 2 183 2 131 2 076– projects 8 4 — — —Total average number of mine employees 2 227 2 066 2 183 2 131 2 076% UG2 mined to total output 18 — — — —OPERATING PERFORMANCEFinancial year2000 1999Profitability and cost statisticsNet sales revenue per Pt ounce sold (R) 7 593 4 312Cash operating costs per Pt ounce refined (R) 4 179 3 475Cash operating costs per 4E kilogram refined (R) 83 047 71 221Operating income statement(R millions)Net sales revenue 548,2 339,8Operating cost of sales* (305,7) (278,9)Operating contribution 242,5 60,9Operating margin % 44,2 17,9*Cost of sales excluding other costsSALIENT STATISTICSFinancial yearRefined production 2000 1999 1998 1997 1996<strong>Platinum</strong> (000’s) (oz) 72,2 78,8 84,0 76,8 79,1Palladium (000’s) (oz) 35,7 35,2 37,0 32,8 33,9Rhodium (000’s) (oz) 4,4 4,5 5,1 4,6 4,7Gold (000’s) (oz) 4,5 5,1 5,0 4,8 5,5Nickel (000’s) (t) 1,1 1,3 1,2 1,1 1,2Copper (000’s) (t) 0,6 0,7 0,7 0,6 0,799


![[PDF] Mogalakwena Mine - Anglo Platinum](https://img.yumpu.com/43065142/1/184x260/pdf-mogalakwena-mine-anglo-platinum.jpg?quality=85)