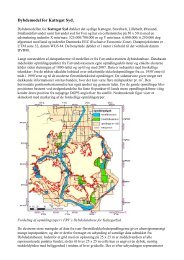
Automatic generation of elevation data over Danish landscape
Automatic generation of elevation data over Danish landscape
Automatic generation of elevation data over Danish landscape

You also want an ePaper? Increase the reach of your titles
YUMPU automatically turns print PDFs into web optimized ePapers that Google loves.
5 Preparation for the grid <strong>generation</strong><br />
5.1.6.1 Correlation<br />
The standard value for the correlation window is 5 x 3 pixels. The threshold value <strong>of</strong> the correlation coefficient<br />
is as a standard value 0.75. The correlation coefficient is described in Appendix A, section A.1.1.1.1.<br />
In this project the <strong>landscape</strong> is considered as flat.<br />
The standard value for the correlation window and the correlation coefficient is selected and fixed. The<br />
choice <strong>of</strong> a flat terrain entails a parallax bound in the x-direction (because <strong>of</strong> the normalised images) <strong>of</strong> 3<br />
pixels, see Chapter 2, section 2.4.3.1.<br />
5.1.6.2 The finite-element reconstruction<br />
In the finite-element reconstruction, the values for the curvature, the torsion, the standard deviation etc.<br />
are fixed. The standard value <strong>of</strong> the curvature and torsion is 3, see the description <strong>of</strong> curvature and torsion<br />
in Chapter 2, section 2.4.3.2. The standard value for the standard deviation <strong>of</strong> the determined terrain<br />
points is 0.20m. The iteration process goes through 2 separate phases. The standard value <strong>of</strong> the first<br />
phase is 6 and for the last phase is 4. The last parameter used in the set up in this project is the threshold<br />
for the bias, the standard value is 35 %.<br />
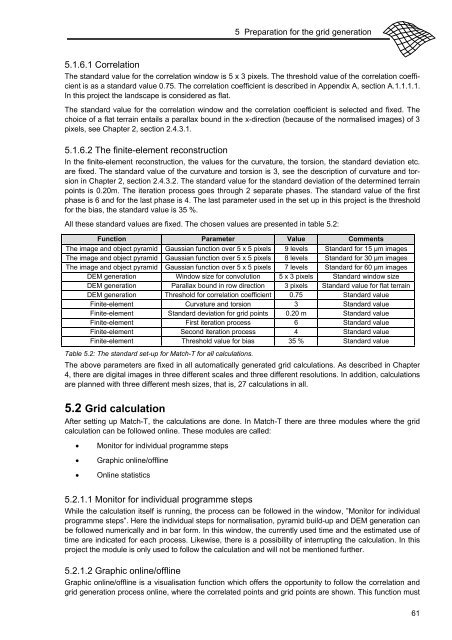
All these standard values are fixed. The chosen values are presented in table 5.2:<br />
Function Parameter Value Comments<br />
The image and object pyramid Gaussian function <strong>over</strong> 5 x 5 pixels 9 levels Standard for 15 μm images<br />
The image and object pyramid Gaussian function <strong>over</strong> 5 x 5 pixels 8 levels Standard for 30 μm images<br />
The image and object pyramid Gaussian function <strong>over</strong> 5 x 5 pixels 7 levels Standard for 60 μm images<br />
DEM <strong>generation</strong> Window size for convolution 5 x 3 pixels Standard window size<br />
DEM <strong>generation</strong> Parallax bound in row direction 3 pixels Standard value for flat terrain<br />
DEM <strong>generation</strong> Threshold for correlation coefficient 0.75 Standard value<br />
Finite-element Curvature and torsion 3 Standard value<br />
Finite-element Standard deviation for grid points 0.20 m Standard value<br />
Finite-element First iteration process 6 Standard value<br />
Finite-element Second iteration process 4 Standard value<br />
Finite-element Threshold value for bias 35 % Standard value<br />
Table 5.2: The standard set-up for Match-T for all calculations.<br />
The above parameters are fixed in all automatically generated grid calculations. As described in Chapter<br />
4, there are digital images in three different scales and three different resolutions. In addition, calculations<br />
are planned with three different mesh sizes, that is, 27 calculations in all.<br />
5.2 Grid calculation<br />
After setting up Match-T, the calculations are done. In Match-T there are three modules where the grid<br />
calculation can be followed online. These modules are called:<br />
� Monitor for individual programme steps<br />
� Graphic online/<strong>of</strong>fline<br />
� Online statistics<br />
5.2.1.1 Monitor for individual programme steps<br />
While the calculation itself is running, the process can be followed in the window, ”Monitor for individual<br />
programme steps”. Here the individual steps for normalisation, pyramid build-up and DEM <strong>generation</strong> can<br />
be followed numerically and in bar form. In this window, the currently used time and the estimated use <strong>of</strong><br />
time are indicated for each process. Likewise, there is a possibility <strong>of</strong> interrupting the calculation. In this<br />
project the module is only used to follow the calculation and will not be mentioned further.<br />
5.2.1.2 Graphic online/<strong>of</strong>fline<br />
Graphic online/<strong>of</strong>fline is a visualisation function which <strong>of</strong>fers the opportunity to follow the correlation and<br />
grid <strong>generation</strong> process online, where the correlated points and grid points are shown. This function must<br />
61