Management <strong>Report</strong> of the Board of Directors <strong>2010</strong>Consolidated Income Statementfor the years ended on 31December <strong>2010</strong> and 2009(Values in thousand Euros)<strong>2010</strong> 2009 Var (%)(TD, SA) (TD-EC)Operation income 1,445,418 1,423,385 1.5%Operating costs 1,295,169 1,210,829 7.0%EBITDA 150,249 212,556 (29.3%)Amortisation and depreciation 59,025 55,369 6.6%Provisions 7,346 628 1069.7%EBIT 83,878 156,559 (46.4%)Financial profit or loss (17,680) (5,368) -Pre-tax profit 66,198 151,191 (56.2%)Income tax 26,820 36,562 (26.6%)Net profit 39,378 114,629 (65.6%)Attributable to:Shareholders 46,392 116,284 (60.1%)Non-controlling interests (7,014) (1,655) -The Consolidated Net Income Attributable to theShareholders was positive by EUR 46,392 thousand.This indicator was influenced by the incorporation ofthe capital gains resulting from the sale of the stakein CIMPOR – Cimentos de Portugal, SGPS, S.A. to theamount of EUR 71,183 thousand, and the appropriationof the net income of this subsidiary up to the date of itsdisposal, to the amount of EUR 9,237 thousand, as wellas by the recording of an impairment loss in the stakeheld by Banco Comercial Português, S.A., with an impacton net income of EUR 64,146 thousand.1,291,073 1,320,4741,379,628755,8591,011,513Turnover grew by 4.5% compared with 2009, havingreached EUR 1,379,628 thousand.Evolution of ConsolidatedTurnover(Values in thousand Euros)2006 2007 2008 2009 <strong>2010</strong>Evolution of Turnover by Markets(Values in thousand Euros)785,312786,995The positive variation was essentially due to the increasesrecorded in some sectors of Portugal and the maintenanceof values similar to 2009 in the external market, whichnow represents 57% of the total of the Teixeira DuarteGroup.535,162592,6332009 <strong>2010</strong>External MarketInternal Market14
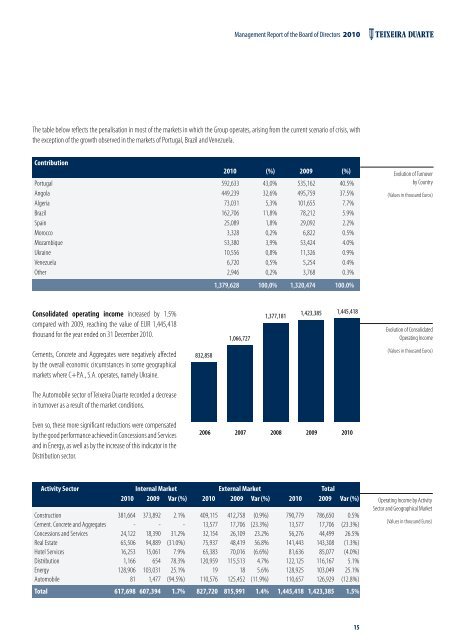
Management <strong>Report</strong> of the Board of Directors <strong>2010</strong>The table below reflects the penalisation in most of the markets in which the Group operates, arising from the current scenario of crisis, withthe exception of the growth observed in the markets of Portugal, Brazil and Venezuela.Countries TD Group Contribution T D G r o u pContribution<strong>2010</strong> (%) 2009 (%)Portugal 592,633 43,0% 535,162 40.5%Angola 449,239 32,6% 495,759 37.5%Algeria 73,031 5,3% 101,655 7.7%Brazil 162,706 11,8% 78,212 5.9%Spain 25,089 1,8% 29,092 2.2%Morocco 3,328 0,2% 6,822 0.5%Mozambique 53,380 3,9% 53,424 4.0%Ukraine 10,556 0,8% 11,326 0.9%Venezuela 6,720 0,5% 5,254 0.4%Other 2,946 0,2% 3,768 0.3%1,379,628 100,0% 1,320,474 100.0%Evolution of Turnoverby Country(Values in thousand Euros)Consolidated operating income increased by 1.5%compared with 2009, reaching the value of EUR 1,445,418thousand for the year ended on 31 December <strong>2010</strong>.1,066,7271,377,1811,423,385 1,445,418Evolution of ConsolidatedOperating IncomeCements, Concrete and Aggregates were negatively affectedby the overall economic circumstances in some geographicalmarkets where C+P.A., S.A. operates, namely Ukraine.832,858(Values in thousand Euros)The Automobile sector of Teixeira Duarte recorded a decreasein turnover as a result of the market conditions.Even so, these more significant reductions were compensatedby the good performance achieved in Concessions and Servicesand in Energy, as well as by the increase of this indicator in theDistribution sector.2006 2007 2008 2009 <strong>2010</strong>Activity Sector Internal Market External Market Total<strong>2010</strong> 2009 Var (%) <strong>2010</strong> 2009 Var (%) <strong>2010</strong> 2009 Var (%)Construction 381,664 373,892 2.1% 409,115 412,758 (0.9%) 790,779 786,650 0.5%Cement. Concrete and Aggregates - - - 13,577 17,706 (23.3%) 13,577 17,706 (23.3%)Concessions and Services 24,122 18,390 31.2% 32,154 26,109 23.2% 56,276 44,499 26.5%Real Estate 65,506 94,889 (31.0%) 75,937 48,419 56.8% 141,443 143,308 (1.3%)Hotel Services 16,253 15,061 7.9% 65,383 70,016 (6.6%) 81,636 85,077 (4.0%)Distribution 1,166 654 78.3% 120,959 115,513 4.7% 122,125 116,167 5.1%Energy 128,906 103,031 25.1% 19 18 5.6% 128,925 103,049 25.1%Automobile 81 1,477 (94.5%) 110,576 125,452 (11.9%) 110,657 126,929 (12.8%)Total 617,698 607,394 1.7% 827,720 815,991 1.4% 1,445,418 1,423,385 1.5%Operating Income by ActivitySector and Geographical Market(Values in thousand Euros)15
- Page 1 and 2: ANNUALREPORT2010
- Page 3: Annual Report 2010
- Page 6 and 7: Teixeira Duarte, S.A.Head Office: L
- Page 8: TEIXEIRA DUARTE ORGANOGRAM2010BOARD
- Page 11 and 12: Management Reportof the Board of Di
- Page 13: Management Report of the Board of D
- Page 17 and 18: Management Report of the Board of D
- Page 19 and 20: Management Report of the Board of D
- Page 21 and 22: Management Report of the Board of D
- Page 25 and 26: Management Report of the Board of D
- Page 27 and 28: Management Report of the Board of D
- Page 29 and 30: Management Report of the Board of D
- Page 31 and 32: Management Report of the Board of D
- Page 33 and 34: Management Report of the Board of D
- Page 35 and 36: Management Report of the Board of D
- Page 37 and 38: Management Report of the Board of D
- Page 39 and 40: Management Report of the Board of D
- Page 41 and 42: Management Report of the Board of D
- Page 43 and 44: Management Report of the Board of D
- Page 45 and 46: Management Report of the Board of D
- Page 47 and 48: Management Report of the Board of D
- Page 49 and 50: Management Report of the Board of D
- Page 51 and 52: Management Report of the Board of D
- Page 53 and 54: Management Report of the Board of D
- Page 55 and 56: Management Report of the Board of D
- Page 57 and 58: Notes to the Management Report of t
- Page 59 and 60: CorporateGovernance Report 2010
- Page 61 and 62: Corporate Governance Report 2010TD-
- Page 63 and 64: Corporate Governance Report 2010I.4
- Page 65 and 66:
Corporate Governance Report 2010II.
- Page 67 and 68:
Corporate Governance Report 2010II.
- Page 69 and 70:
Corporate Governance Report 2010III
- Page 71 and 72:
Corporate Governance Report 20101.4
- Page 73 and 74:
Corporate Governance Report 2010The
- Page 75 and 76:
Corporate Governance Report 2010The
- Page 77 and 78:
Corporate Governance Report 2010I.1
- Page 79 and 80:
Corporate Governance Report 2010com
- Page 81 and 82:
Corporate Governance Report 2010TD-
- Page 84 and 85:
Corporate Governance Report 2010Con
- Page 86 and 87:
Corporate Governance Report 2010The
- Page 88 and 89:
Corporate Governance Report 2010The
- Page 90:
Corporate Governance Report 2010The
- Page 93 and 94:
Corporate Governance Report 2010II.
- Page 95 and 96:
Corporate Governance Report 2010Cha
- Page 97 and 98:
Corporate Governance Report 2010Man
- Page 99:
Corporate Governance Report 2010Mem
- Page 102:
Corporate Governance Report 2010Cha
- Page 105 and 106:
Corporate Governance Report 2010Dir
- Page 107 and 108:
Corporate Governance Report 2010The
- Page 109 and 110:
Corporate Governance Report 2010Att
- Page 111 and 112:
Corporate Governance Report 2010As
- Page 113 and 114:
Corporate Governance Report 2010The
- Page 116 and 117:
Corporate Governance Report 2010All
- Page 118 and 119:
Corporate Governance Report 2010bon
- Page 120 and 121:
Corporate Governance Report 2010pro
- Page 122 and 123:
Corporate Governance Report 2010as
- Page 124 and 125:
Corporate Governance Report 2010The
- Page 126 and 127:
Corporate Governance Report 2010III
- Page 128 and 129:
Corporate Governance Report 2010The
- Page 130 and 131:
Balance Sheet as at 31 December 201
- Page 132 and 133:
Statement of Changes in Equity for
- Page 134 and 135:
Financial Statements 2010NOTESAs at
- Page 136 and 137:
Financial Statements 2010f) Cash an
- Page 138 and 139:
Financial Statements 20106.2. Inves
- Page 140 and 141:
Financial Statements 20108.4. As at
- Page 142 and 143:
Financial Statements 2010Identifica
- Page 144 and 145:
Consolidated Statement of the Finan
- Page 146 and 147:
Consolidated Full Income Statement
- Page 148 and 149:
Consolidated Cash Flow Statement fo
- Page 150 and 151:
Notes to the Consolidated Financial
- Page 152 and 153:
Notes to the Consolidated Financial
- Page 154 and 155:
Notes to the Consolidated Financial
- Page 156 and 157:
Notes to the Consolidated Financial
- Page 158 and 159:
Notes to the Consolidated Financial
- Page 160 and 161:
Notes to the Consolidated Financial
- Page 162 and 163:
Notes to the Consolidated Financial
- Page 164 and 165:
Notes to the Consolidated Financial
- Page 166 and 167:
Notes to the Consolidated Financial
- Page 168 and 169:
Notes to the Consolidated Financial
- Page 170 and 171:
Notes to the Consolidated Financial
- Page 172 and 173:
Notes to the Consolidated Financial
- Page 174 and 175:
Notes to the Consolidated Financial
- Page 176 and 177:
Notes to the Consolidated Financial
- Page 178 and 179:
Notes to the Consolidated Financial
- Page 180 and 181:
Notes to the Consolidated Financial
- Page 182 and 183:
Notes to the Consolidated Financial
- Page 184 and 185:
Notes to the Consolidated Financial
- Page 186 and 187:
Notes to the Consolidated Financial
- Page 188 and 189:
Notes to the Consolidated Financial
- Page 190 and 191:
Notes to the Consolidated Financial
- Page 192 and 193:
Notes to the Consolidated Financial
- Page 194 and 195:
Notes to the Consolidated Financial
- Page 196 and 197:
Notes to the Consolidated Financial
- Page 198 and 199:
Notes to the Consolidated Financial
- Page 200 and 201:
Notes to the Consolidated Financial
- Page 202 and 203:
Notes to the Consolidated Financial
- Page 204 and 205:
Notes to the Consolidated Financial
- Page 206:
Report and Opinion of the Superviso