- Page 1 and 2: ANNUALREPORT2010
- Page 3: Annual Report 2010
- Page 6 and 7: Teixeira Duarte, S.A.Head Office: L
- Page 8: TEIXEIRA DUARTE ORGANOGRAM2010BOARD
- Page 11 and 12: Management Reportof the Board of Di
- Page 13 and 14: Management Report of the Board of D
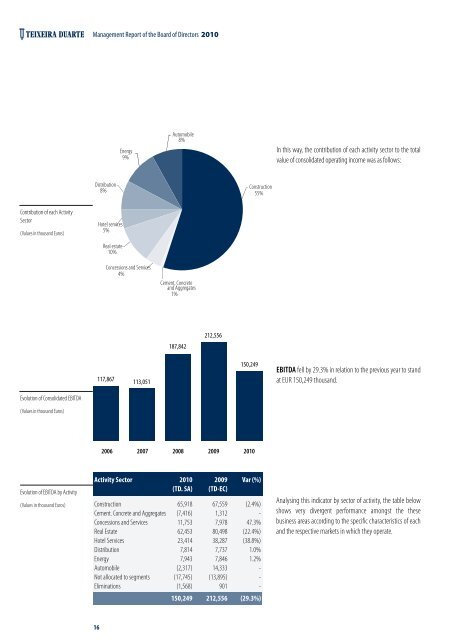
- Page 15: Management Report of the Board of D
- Page 19 and 20: Management Report of the Board of D
- Page 21 and 22: Management Report of the Board of D
- Page 25 and 26: Management Report of the Board of D
- Page 27 and 28: Management Report of the Board of D
- Page 29 and 30: Management Report of the Board of D
- Page 31 and 32: Management Report of the Board of D
- Page 33 and 34: Management Report of the Board of D
- Page 35 and 36: Management Report of the Board of D
- Page 37 and 38: Management Report of the Board of D
- Page 39 and 40: Management Report of the Board of D
- Page 41 and 42: Management Report of the Board of D
- Page 43 and 44: Management Report of the Board of D
- Page 45 and 46: Management Report of the Board of D
- Page 47 and 48: Management Report of the Board of D
- Page 49 and 50: Management Report of the Board of D
- Page 51 and 52: Management Report of the Board of D
- Page 53 and 54: Management Report of the Board of D
- Page 55 and 56: Management Report of the Board of D
- Page 57 and 58: Notes to the Management Report of t
- Page 59 and 60: CorporateGovernance Report 2010
- Page 61 and 62: Corporate Governance Report 2010TD-
- Page 63 and 64: Corporate Governance Report 2010I.4
- Page 65 and 66: Corporate Governance Report 2010II.
- Page 67 and 68:
Corporate Governance Report 2010II.
- Page 69 and 70:
Corporate Governance Report 2010III
- Page 71 and 72:
Corporate Governance Report 20101.4
- Page 73 and 74:
Corporate Governance Report 2010The
- Page 75 and 76:
Corporate Governance Report 2010The
- Page 77 and 78:
Corporate Governance Report 2010I.1
- Page 79 and 80:
Corporate Governance Report 2010com
- Page 81 and 82:
Corporate Governance Report 2010TD-
- Page 84 and 85:
Corporate Governance Report 2010Con
- Page 86 and 87:
Corporate Governance Report 2010The
- Page 88 and 89:
Corporate Governance Report 2010The
- Page 90:
Corporate Governance Report 2010The
- Page 93 and 94:
Corporate Governance Report 2010II.
- Page 95 and 96:
Corporate Governance Report 2010Cha
- Page 97 and 98:
Corporate Governance Report 2010Man
- Page 99:
Corporate Governance Report 2010Mem
- Page 102:
Corporate Governance Report 2010Cha
- Page 105 and 106:
Corporate Governance Report 2010Dir
- Page 107 and 108:
Corporate Governance Report 2010The
- Page 109 and 110:
Corporate Governance Report 2010Att
- Page 111 and 112:
Corporate Governance Report 2010As
- Page 113 and 114:
Corporate Governance Report 2010The
- Page 116 and 117:
Corporate Governance Report 2010All
- Page 118 and 119:
Corporate Governance Report 2010bon
- Page 120 and 121:
Corporate Governance Report 2010pro
- Page 122 and 123:
Corporate Governance Report 2010as
- Page 124 and 125:
Corporate Governance Report 2010The
- Page 126 and 127:
Corporate Governance Report 2010III
- Page 128 and 129:
Corporate Governance Report 2010The
- Page 130 and 131:
Balance Sheet as at 31 December 201
- Page 132 and 133:
Statement of Changes in Equity for
- Page 134 and 135:
Financial Statements 2010NOTESAs at
- Page 136 and 137:
Financial Statements 2010f) Cash an
- Page 138 and 139:
Financial Statements 20106.2. Inves
- Page 140 and 141:
Financial Statements 20108.4. As at
- Page 142 and 143:
Financial Statements 2010Identifica
- Page 144 and 145:
Consolidated Statement of the Finan
- Page 146 and 147:
Consolidated Full Income Statement
- Page 148 and 149:
Consolidated Cash Flow Statement fo
- Page 150 and 151:
Notes to the Consolidated Financial
- Page 152 and 153:
Notes to the Consolidated Financial
- Page 154 and 155:
Notes to the Consolidated Financial
- Page 156 and 157:
Notes to the Consolidated Financial
- Page 158 and 159:
Notes to the Consolidated Financial
- Page 160 and 161:
Notes to the Consolidated Financial
- Page 162 and 163:
Notes to the Consolidated Financial
- Page 164 and 165:
Notes to the Consolidated Financial
- Page 166 and 167:
Notes to the Consolidated Financial
- Page 168 and 169:
Notes to the Consolidated Financial
- Page 170 and 171:
Notes to the Consolidated Financial
- Page 172 and 173:
Notes to the Consolidated Financial
- Page 174 and 175:
Notes to the Consolidated Financial
- Page 176 and 177:
Notes to the Consolidated Financial
- Page 178 and 179:
Notes to the Consolidated Financial
- Page 180 and 181:
Notes to the Consolidated Financial
- Page 182 and 183:
Notes to the Consolidated Financial
- Page 184 and 185:
Notes to the Consolidated Financial
- Page 186 and 187:
Notes to the Consolidated Financial
- Page 188 and 189:
Notes to the Consolidated Financial
- Page 190 and 191:
Notes to the Consolidated Financial
- Page 192 and 193:
Notes to the Consolidated Financial
- Page 194 and 195:
Notes to the Consolidated Financial
- Page 196 and 197:
Notes to the Consolidated Financial
- Page 198 and 199:
Notes to the Consolidated Financial
- Page 200 and 201:
Notes to the Consolidated Financial
- Page 202 and 203:
Notes to the Consolidated Financial
- Page 204 and 205:
Notes to the Consolidated Financial
- Page 206:
Report and Opinion of the Superviso