Simulation of Water-Gas Shift Membrane Reactor for Integrated ...
Simulation of Water-Gas Shift Membrane Reactor for Integrated ...
Simulation of Water-Gas Shift Membrane Reactor for Integrated ...
- No tags were found...

Create successful ePaper yourself
Turn your PDF publications into a flip-book with our unique Google optimized e-Paper software.
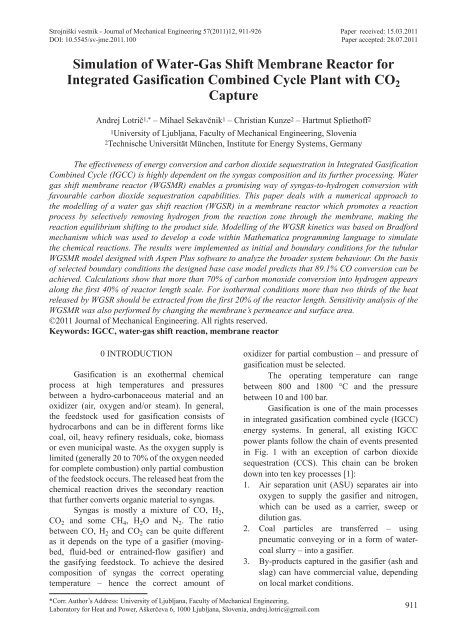
Strojniški vestnik - Journal <strong>of</strong> Mechanical Engineering 57(2011)12, 911-926 Paper received: 15.03.2011DOI: 10.5545/sv-jme.2011.100 Paper accepted: 28.07.2011<strong>Simulation</strong> <strong>of</strong> <strong>Water</strong>-<strong>Gas</strong> <strong>Shift</strong> <strong>Membrane</strong> <strong>Reactor</strong> <strong>for</strong><strong>Integrated</strong> <strong>Gas</strong>ification Combined Cycle Plant with CO 2CaptureLotrič, A. ‒ Sekavčnik, M. ‒ Kunze, C. ‒ Splieth<strong>of</strong>f, H.Andrej Lotrič 1,* ‒ Mihael Sekavčnik 1 ‒ Christian Kunze 2 ‒ Hartmut Splieth<strong>of</strong>f 21University <strong>of</strong> Ljubljana, Faculty <strong>of</strong> Mechanical Engineering, Slovenia2Technische Universität München, Institute <strong>for</strong> Energy Systems, GermanyThe effectiveness <strong>of</strong> energy conversion and carbon dioxide sequestration in <strong>Integrated</strong> <strong>Gas</strong>ificationCombined Cycle (IGCC) is highly dependent on the syngas composition and its further processing. <strong>Water</strong>gas shift membrane reactor (WGSMR) enables a promising way <strong>of</strong> syngas-to-hydrogen conversion withfavourable carbon dioxide sequestration capabilities. This paper deals with a numerical approach tothe modelling <strong>of</strong> a water gas shift reaction (WGSR) in a membrane reactor which promotes a reactionprocess by selectively removing hydrogen from the reaction zone through the membrane, making thereaction equilibrium shifting to the product side. Modelling <strong>of</strong> the WGSR kinetics was based on Brad<strong>for</strong>dmechanism which was used to develop a code within Mathematica programming language to simulatethe chemical reactions. The results were implemented as initial and boundary conditions <strong>for</strong> the tubularWGSMR model designed with Aspen Plus s<strong>of</strong>tware to analyze the broader system behaviour. On the basis<strong>of</strong> selected boundary conditions the designed base case model predicts that 89.1% CO conversion can beachieved. Calculations show that more than 70% <strong>of</strong> carbon monoxide conversion into hydrogen appearsalong the first 40% <strong>of</strong> reactor length scale. For isothermal conditions more than two thirds <strong>of</strong> the heatreleased by WGSR should be extracted from the first 20% <strong>of</strong> the reactor length. Sensitivity analysis <strong>of</strong> theWGSMR was also per<strong>for</strong>med by changing the membrane’s permeance and surface area.©2011 Journal <strong>of</strong> Mechanical Engineering. All rights reserved.Keywords: IGCC, water-gas shift reaction, membrane reactor0 INTRODUCTION<strong>Gas</strong>ification is an exothermal chemicalprocess at high temperatures and pressuresbetween a hydro-carbonaceous material and anoxidizer (air, oxygen and/or steam). In general,the feedstock used <strong>for</strong> gasification consists <strong>of</strong>hydrocarbons and can be in different <strong>for</strong>ms likecoal, oil, heavy refinery residuals, coke, biomassor even municipal waste. As the oxygen supply islimited (generally 20 to 70% <strong>of</strong> the oxygen needed<strong>for</strong> complete combustion) only partial combustion<strong>of</strong> the feedstock occurs. The released heat from thechemical reaction drives the secondary reactionthat further converts organic material to syngas.Syngas is mostly a mixture <strong>of</strong> CO, H 2 ,CO 2 and some CH 4 , H 2 O and N 2 . The ratiobetween CO, H 2 and CO 2 can be quite differentas it depends on the type <strong>of</strong> a gasifier (movingbed,fluid-bed or entrained-flow gasifier) andthe gasifying feedstock. To achieve the desiredcomposition <strong>of</strong> syngas the correct operatingtemperature – hence the correct amount <strong>of</strong>oxidizer <strong>for</strong> partial combustion – and pressure <strong>of</strong>gasification must be selected.The operating temperature can rangebetween 800 and 1800 °C and the pressurebetween 10 and 100 bar.<strong>Gas</strong>ification is one <strong>of</strong> the main processesin integrated gasification combined cycle (IGCC)energy systems. In general, all existing IGCCpower plants follow the chain <strong>of</strong> events presentedin Fig. 1 with an exception <strong>of</strong> carbon dioxidesequestration (CCS). This chain can be brokendown into ten key processes [1]:1. Air separation unit (ASU) separates air intooxygen to supply the gasifier and nitrogen,which can be used as a carrier, sweep ordilution gas.2. Coal particles are transferred – usingpneumatic conveying or in a <strong>for</strong>m <strong>of</strong> watercoalslurry – into a gasifier.3. By-products captured in the gasifier (ash andslag) can have commercial value, dependingon local market conditions.*Corr. Author’s Address: University <strong>of</strong> Ljubljana, Faculty <strong>of</strong> Mechanical Engineering,Laboratory <strong>for</strong> Heat and Power, Aškerčeva 6, 1000 Ljubljana, Slovenia, andrej.lotric@gmail.com911
Strojniški vestnik - Journal <strong>of</strong> Mechanical Engineering 57(2011)12, 911-9264. The syngas also has small amounts <strong>of</strong> otherimpurities (e.g. H 2 S, COS, NH 3 and alsochlorides, fluorides, mercury etc.) which areremoved during the gas clean-up. Be<strong>for</strong>e theclean-up process syngas is cooled, usuallyin a syngas cooler, where part (or all) <strong>of</strong>the steam used in the gasification process isproduced.5. Around 99% <strong>of</strong> H 2 S is separated from thesyngas and converted to elemental sulphur orpossibly sulphuric acid.6. Nowadays, the syngas is passed through a twostage WGS reactor and reacted over a catalystwith added steam to convert the majority <strong>of</strong>the CO into CO 2 and additional H 2 . The H 2is separated from the gas mixture usually byusing the pressure swing adsorption (PSA)process.7. The future potential <strong>of</strong> IGCC systems is theCO 2 removal, leaving H 2 -rich syngas behind.8. Syngas can also be used in variety <strong>of</strong>processes; like production <strong>of</strong> synthetic fuelsor chemicals and pure H 2 can be used in fuelcells or combined cycle to produce electricity.9. The main cause <strong>for</strong> IGCC plants being moreefficient than conventional power plants isthe combined use <strong>of</strong> a gas and a steam turbineto produce electricity.10. Much <strong>of</strong> the water used in this processis recycled in the plant, while some isevaporated in a cooling tower.1 WATER-GAS SHIFT REACTION PROCESS1.1 <strong>Membrane</strong> <strong>Reactor</strong>In general, the membrane reactor (MR) isa device that combines a membrane separationprocess with a chemical reactor in one unit. TheMR is capable <strong>of</strong> promoting a reaction process byselectively removing at least one <strong>of</strong> the productsfrom the reaction zone through the membrane,making the equilibrium reaction shifting to theproduct side.Fig. 1. Schematic presentation <strong>of</strong> the syngas production, hydrogen separation, CCS and hydrogenutilisation in the IGCC912 Lotrič, A. ‒ Sekavčnik, M. ‒ Kunze, C. ‒ Splieth<strong>of</strong>f, H.
Strojniški vestnik - Journal <strong>of</strong> Mechanical Engineering 57(2011)12, 911 -926Fig. 2. WGSR process in the MRThe membrane used is highly selective tothe product <strong>of</strong> interest there<strong>for</strong>e, the product can bedirectly recovered during the reaction, eliminatingthe need <strong>for</strong> additional product purification steps.The rate <strong>of</strong> the product flux throughthe membrane is proportional to the product’spartial pressure difference between the process(feed) side and the permeate side; there<strong>for</strong>e, theextracted product is recovered at a lower pressurethan the process stream pressure. To increase thepressure difference, the inert diluting (or carrier)gas is sometimes used. The diluting gas is carryingaway the permeated product there<strong>for</strong>e, reducingthe concentration on the permeate side and thus,increasing the driving <strong>for</strong>ce <strong>for</strong> permeation. Thepressure drop through the membrane is materialdependent, and it obeys different laws <strong>for</strong> differentmembrane materials.With MR the yield can be increased (evenbeyond the equilibrium value <strong>for</strong> equilibriumreactions) and/or the selectivity can be improvedby suppressing other undesired side reactions orthe secondary reaction <strong>of</strong> products. Due to theintegration <strong>of</strong> reaction and separation, chemicalprocesses become simpler leading to a muchlower processing cost.According to Eq. (1) changing the pressure<strong>of</strong> the WGSR should not have any considerableeffect on changing the equilibrium concentrationsbecause the equation is equimolar. However, theexperimental results, obtained from [2], showthat very high pressures slightly favour the COconversion which can be seen in the Table 1.Table 1. Effect <strong>of</strong> pressure on equilibriumCO concentrations (inlet dry gas: 13.2% CO,10.3% CO 2 , 35.3% H 2 , 41.2% N 2 , steam-to-drygas = 0.5)Temperature[°C]p =3.04 bar[% CO]p =30.39 bar[% CO]p =303.9 bar[%CO]200 0.12 0.12 0.07300 0.68 0.65 0.48400 1.98 1.94 1.61500 3.93 3.88 3.46600 6.15 6.10 5.68700 8.38 8.34 7.951.2 <strong>Water</strong>-<strong>Gas</strong> <strong>Shift</strong> ReactionThe equilibrium <strong>of</strong> reversible reactionscan be shifted toward more product <strong>for</strong>mationby changing reaction conditions such as pressureand temperature or concentrations <strong>of</strong> reactants orproducts.The main focus <strong>of</strong> this paper is the<strong>Water</strong>‐<strong>Gas</strong> <strong>Shift</strong> Reaction (WGSR), which is alsoan equilibrium reaction and it is represented withthe following equation:CO + H 2 O ↔ CO 2 + H 2 ‒ 41 MJ/kmol . (1)Fig. 3. Reactant conversion <strong>for</strong> the WGSR whereH 2 and CO 2 are not present at the beginning [3]On the other hand, it is well known thatincreasing the temperature has a decreasingeffect on equilibrium CO conversion. There<strong>for</strong>e,H 2 yield can be considerably enhanced at high<strong>Simulation</strong> <strong>of</strong> <strong>Water</strong>-<strong>Gas</strong> <strong>Shift</strong> <strong>Membrane</strong> <strong>Reactor</strong> <strong>for</strong> <strong>Integrated</strong> <strong>Gas</strong>ification Combined Cycle Plantwith CO 2 Capture913
Strojniški vestnik - Journal <strong>of</strong> Mechanical Engineering 57(2011)12, 911-926reaction temperatures, at which the equilibriumCO conversion would otherwise be low, byextracting either CO 2 or H 2 from the reactionmixture.1.3 <strong>Water</strong>-<strong>Gas</strong> <strong>Shift</strong> Kinetics1.3.1 General Definition <strong>of</strong> Rate LawChemical kinetics investigates howdifferent experimental conditions can influencethe chemical reaction rate. The main factors thatcan speed up the reaction rate include increasein the concentrations <strong>of</strong> the reactants, increasein temperature or pressure at which the reactionoccurs and whether or not any catalysts are presentin the reaction.Usually, what appears to be a single stepconversion is in fact a multistep reaction and thus,the reaction mechanism is a step by step sequence<strong>of</strong> elementary reactions. Each step has its ownrate law and molecularity (the number <strong>of</strong> speciestaking part in that step); there<strong>for</strong>e the slowest stepis the one that determines the overall reactionrate – the rate limiting step.Only <strong>for</strong> simple (elementary) reactionsa partial order <strong>of</strong> reaction is the same as thestoichiometric number <strong>of</strong> the reactant concerned.For stepwise reactions there is no generalconnection between stoichiometric numbers andpartial orders. Such reactions may have morecomplex rate laws and the orders <strong>of</strong> reaction are inprinciple always assigned to the elementary steps.By conducting experiments involvingreactants A and B, one would find that the rate <strong>of</strong>the reaction r is related to the concentrations [A]and [B] in a rate law as:r = k [A] a [B] b , (2)where k is the rate constant and the powers a andb are called the partial orders <strong>of</strong> the reaction. Theoverall order <strong>of</strong> the reaction is found by adding upthe partial orders. The rate constant is not a trueconstant because it is dependent on the reaction’stemperature T and the activation energy E a and isdefined via Arrhenius equation as:Ea−k = k ⋅eRT ⋅0 , (3)where k 0 is the pre-exponential factor.A pair <strong>of</strong> <strong>for</strong>ward and backward reactionsmay define an equilibrium process where A and Breact into C and D and vice versa (a, b, c and d arethe stoichiometric coefficients):aA+ bB ⇔ cC+ d D(4)Assuming that above reactions areelementary, the reaction rate can be expressed as:r = k 1·[A] a·[B] b ‒ k 2·[C] c·[D] d , (5)where k 1 is the rate coefficient <strong>for</strong> the <strong>for</strong>wardreaction which consumes A and B; k 2 is the ratecoefficient <strong>for</strong> the backward reaction, whichconsumes C and D.In a reversible reaction, like WGSR,chemical equilibrium is reached when the rates <strong>of</strong>the <strong>for</strong>ward and backward reactions are equal andthe concentrations <strong>of</strong> the reactants and products nolonger change (r = 0 in balance).1.3.2 Brad<strong>for</strong>d Mechanisma) Backward WGSRBrad<strong>for</strong>d [4] assumed that the reactionmechanism would follow the simple gas-phasechain-reaction mechanism given below (Mindicates any gas-phase collision partner). Thechain is initiated by the gas-phase dissociation<strong>of</strong> hydrogen (Eq. (6)). Propagation steps arerepresented by reactions in Eqs. (7) and (8). Thetermination step corresponds to the gas-phase reassociation<strong>of</strong> H 2 in Eq. (9), consuming the chaincarriers.H2k1+ M ⎯⎯ →2H+M, (6)2H+ CO ←⎯⎯⎯⎯ →CO+OH, (7)2k−2k2 k2k3OH + H ←⎯⎯⎯⎯ →H O+H, (8)−3k−12 MH+ ⎯⎯ →H 2 + M. (9)With the assumption <strong>of</strong> low conversionand a stationary state <strong>for</strong> the concentrations <strong>of</strong>the intermediates (H and OH concentrations donot change significantly with respect to time), thefollowing rate equation r b is obtained,rdCOdtkk[ ] b = = ⎛ ⎝ ⎜ 1⎞−112 /12 /⎟ ⋅k2⋅[ H2] ⋅[ CO2]. (10)⎠914 Lotrič, A. ‒ Sekavčnik, M. ‒ Kunze, C. ‒ Splieth<strong>of</strong>f, H.
Strojniški vestnik - Journal <strong>of</strong> Mechanical Engineering 57(2011)12, 911 -926There<strong>for</strong>e, the rate constant <strong>for</strong> thebackward WGSR k b may be expressed as:12 /kkb = ⎛ ⎝ ⎜1⎞⎟ 2k−1⎠where the temperature dependence <strong>of</strong> the rateconstant is described with the Arrhenius Eq. (3).Consequently, the expression <strong>for</strong> the rate <strong>of</strong>reaction in terms <strong>of</strong> k b becomes:rb⋅ k , (11)d [ CO ] 12 /= = kb⋅[ H2] ⋅[ CO2],. (12)dtb) Forward WGSRThe gas-phase, chain-reaction mechanismproposed by Brad<strong>for</strong>d [4] can also be used todescribe the <strong>for</strong>ward WGSR. Reaction in Eq.(13) provides the chain initiation by the reaction<strong>of</strong> H 2 O with any gas-phase molecule (designatedby M). Reactions in Eqs. (14) and (15) are thepropagation steps, while the reaction in Eq. (16) isthe termination step.4HO+ M ⎯⎯ →H+ OH + M, (13)2k5CO + OH ←⎯⎯⎯⎯ →H+CO2 , (14)k − 5k2 2k − 6k6HO+ H←⎯⎯⎯⎯ →OH+H , (15)k−H+ OH+ M ⎯⎯ 4→H O + M. (16)The stationary-state approximation <strong>for</strong> theconcentration <strong>of</strong> the chain-carriers (H and OH)under the conditions <strong>of</strong> low conversions leads tothe following expression <strong>for</strong> the <strong>for</strong>ward WGSRrate <strong>of</strong> reaction r f :2rdCOdt2f = [ ] =⎛ k4⎞= ⎜ ⋅k5⋅k6⎝ k−4⎠12 /12 /⎟ ⋅[ CO] ⋅[ HO]2.(17)The rate constant <strong>for</strong> the <strong>for</strong>ward WGSR k fis defined as:12 /⎛ k4⎞k f = ⎜ ⋅k5⋅k6⎟, (18)⎝ k−4⎠and the rate can be expressed as:d CO2 12 /rfk f COdt[ ] = = ⋅[ ] ⋅[ HO]2 MODEL OF WATER-GAS SHIFTMEMBRANE REACTOR2. (19)At the beginning it was assumed thatthe use <strong>of</strong> different unit models integrated insimulation s<strong>of</strong>tware Aspen Plus will be sufficientto model the MR. However, it turned out thatthe model could not correctly predict the processtaking place inside <strong>of</strong> the reactor. This is why thedecision was made to include the WGSR kinetics,which gave a better overview <strong>of</strong> what occursinside the reactor.The modelling <strong>of</strong> the WGSMR wasconducted by using both the Mathematicaprogramming language and Aspen Plus. Thecalculations made in Mathematica were based onWGSR kinetics and used to predict the reactionFig. 4. Boundary conditions <strong>for</strong> the modelled system and link between Mathematica and Aspen Plusenvironment<strong>Simulation</strong> <strong>of</strong> <strong>Water</strong>-<strong>Gas</strong> <strong>Shift</strong> <strong>Membrane</strong> <strong>Reactor</strong> <strong>for</strong> <strong>Integrated</strong> <strong>Gas</strong>ification Combined Cycle Plantwith CO 2 Capture915
Strojniški vestnik - Journal <strong>of</strong> Mechanical Engineering 57(2011)12, 911-926rate and the permeation through the membrane.The calculated data were then imported in AspenPlus as input (or initial) values <strong>for</strong> simulations.Aspen Plus was used to predict thebehaviour <strong>of</strong> a WGSMR by using basic engineeringrelationships, such as mass and energy balances,and phase and chemical equilibrium. According tothe calculated data from Mathematica, predictedoperating conditions, and different design models,the behaviour <strong>of</strong> MR was simulated.around 1.1 can be reached with quench waterat 260 °C.2.1 Initial and Boundary ConditionsIn IGCC system the MR will be situatedafter the gasifier and be<strong>for</strong>e the gas turbinecombustor, replacing the WGS reactor and PSAsystem (see Fig. 1).The boundaries <strong>for</strong> the modelled systemare marked with the dashed line in Fig. 4. Inthis figure n represents the molar flow, x thecomposition, T the temperature and p the pressure<strong>of</strong> gas stream. Heat duty is represented with Qand CO conversion with X CO . Index GAS stands <strong>for</strong>syngas, R <strong>for</strong> retentate side and P <strong>for</strong> permeate side<strong>of</strong> the membrane.Based on the position in the chain <strong>of</strong>processes that take part in the IGCC, the initialand boundary conditions <strong>for</strong> “base case” studieswere defined:a) Based on gasifier:• The modelling is based on a dry-feedentrained-flow gasifier with water quench.There<strong>for</strong>e, the maximum outlet pressure fromthe gasifier is presumed to be around 50 bar.• The outlet temperature from the gasifier is setto 1500 °C.• Composition <strong>of</strong> syngas has a major role indefining the steam-to-CO ratio and especiallyin defining the H 2 partial pressure.b) Based on quench:• The quench temperature is set to 800 °C. Inorder to reach this temperature the syngas hasto be quenched with water and not steam.• With pressure <strong>of</strong> 50 bar, equal to syngas,quench water can only reach temperaturesup to 264 °C, otherwise it would begin tovaporise.• Steam-to-CO ratio is also dependent on thetemperature <strong>of</strong> quench water. Maximum ratioFig. 5. Schematic presentation <strong>of</strong> the reactormodelc) Based on MR:• For modelling the tubular MR with gaugemeasurements L = 40 m and a = 10 m wasselected (see Fig. 5). The outer tubularmembrane diameter was set to the value 2r =7.5 cm.• The operational temperature range <strong>of</strong> the MRis presumed to be between 700 and 900 °C.• The pressure on the retentate side is definedby the outlet from the gasifier. In this study itis presumed to be 50 bar.• Low pressure on the permeate side increasesthe driving <strong>for</strong>ce through the membrane.However, from the point <strong>of</strong> energy lossneeded <strong>for</strong> compression the minimumpressure should not be less than 1 bar.• In order to improve the driving <strong>for</strong>ce the N 2sweep gas is introduced. In view <strong>of</strong> syngasthe flow <strong>of</strong> N 2 is in counter-current directionwhere H 2 -to-N 2 molar ratio at the exit is 1:1.• Since the WGSR is an exothermal reaction,the reactor is water cooled. In the presentstudy the MR will operate at isothermalconditions.• The desired CO conversion is set to be around95%.• Based on the temperature range, pressureconditions, hydrogen purity and permeability,the selected membrane material isPalladium based with permeance:k′ = 3·10 -4 mol m -2 s -1 Pa -0.5 .916 Lotrič, A. ‒ Sekavčnik, M. ‒ Kunze, C. ‒ Splieth<strong>of</strong>f, H.
Strojniški vestnik - Journal <strong>of</strong> Mechanical Engineering 57(2011)12, 911 -926Fig. 6. Presentation <strong>of</strong> the numerical model <strong>for</strong> calculations <strong>of</strong> WGSR kinetics• Due to the high temperatures no catalyst isused <strong>for</strong> the WGSR.• In this model it is presumed that the membranematerial can withstand the acid environmentthere<strong>for</strong>e no pre-cleaning <strong>of</strong> syngas is needed.• The model <strong>of</strong> the reactor is based on a plugflow reactor. This means that there is nochange in concentration in radial direction.• In the kinetic model it is presumed that thereare no pressure losses on the retentate or onthe permeate side.2.2 Numerical ModelThe numerical model in Mathematica wascreated in such a way that each reactor tube wasdivided in N O = 10,000 infinitesimal sections withlength Dx. The calculation started with valuesobtained from initial and boundary conditions,which gave the values <strong>for</strong> the first section. Ingeneral, the calculations were conducted in sucha way that the results from section marked withindex i were used to calculate the values indexedas i+1 until reaching the last N Oth section.a) Retentate side:Combining Eqs. (5), (12) and (19) thereaction rate <strong>for</strong> section i+1 was calculated as:12 / 12 /i f i b i ir+ 1 k CO HO 2 k H2CO 2= ⋅[ ] ⋅[ ]− ⋅[ ] ⋅[ ]. (20)The flux in section i+1 was calculated withthe following Eq.:Ji+ 1 = k ′⋅ ( pRH2, i − pPH2, i ), (21)where permeance was held at constant valuek′ = 3·10 -4 mol m -2 s -1 Pa -0.5 .. This value wasselected based on the experimental study madeby Ciocco et al. [5] where the permeance <strong>of</strong> purePd membrane k′ = 3·10 -4 mol m -2 s -1 Pa -0.5 . wasachieved.Based on Fig. 6 the Law <strong>of</strong> Conservation<strong>of</strong> Mass must apply <strong>for</strong> each section there<strong>for</strong>e, themolar flow <strong>of</strong> each specie was calculated with thefollowing set <strong>of</strong> Eqs.:n = n + n − n(22)RH 2, i+ 1 RH2, i reaction, i+ 1 H2, i+1,n = n + n(23)CO2, i+ 1 CO2, i reaction, i+1,nCO, i+ 1 = nCO, i −nreaction , i+1 , (24)n = n − n. (25)H2O, i+ 1 H2Oi , reaction, i+1,In the above set <strong>of</strong> Eqs. n reaction,i+1 andn H2,i+1 were defined as:nreaction, i+ 1 = ri+1⋅NTUBES⋅ ∆ V,(26)n = J ⋅N ⋅∆ A (27)H2, i+ 1 i+1 TUBES .The molar flow <strong>of</strong> the retentate gas streamwas a sum <strong>of</strong> all calculated molar flows and theinert species in this study (Ar, H 2 S, N 2 , COS, HCl,CH 4 and others):nRi , + 1 = nRH2, i+ 1+ nCO2,i+1 +(28)+ n + n + nCO, i+ 1 H2O, i+1 inert .The molar fraction <strong>of</strong> each species wascalculated using the equation:<strong>Simulation</strong> <strong>of</strong> <strong>Water</strong>-<strong>Gas</strong> <strong>Shift</strong> <strong>Membrane</strong> <strong>Reactor</strong> <strong>for</strong> <strong>Integrated</strong> <strong>Gas</strong>ification Combined Cycle Plantwith CO 2 Capture917
Strojniški vestnik - Journal <strong>of</strong> Mechanical Engineering 57(2011)12, 911-926Table 2. Activation energies and pre-exponential factors <strong>for</strong> <strong>for</strong>ward and backward WGSR obtained fromliterature; the rate constants <strong>for</strong> WGSR were calculated at operating temperature 1073 KSourceE af[J/mol]k 0f[(l/mol) 0.5 s -1 ]E ab[J/mol]k 0b[(l/mol) 0.5 s -1 ]k f[(cm 3 /mol) 0.5 s -1 ]k b[(cm 3 /mol) 0.5 s -1 ]Culbertson [8] 334.72 7.7·10 45·T-10 (i) / / 6.10 /Graven & Long [9] 281.58 5.0·10 12 238.49 9.5·10 10 3.10 7.37Bustamante [10] 253.55 1.52·10 10 218.40 6.65·10 8 0.22 0.49(i)The pre-exponential factor is also temperature dependant there<strong>for</strong>e the correct unit is K 10 (l/mol) 0.5 s -1 .xji , + 1n=nji , + 1Ri , + 1,(29)where j represents individual specie (H 2 , CO 2 , COor H 2 O).Similarly, the concentration <strong>of</strong> each specieswas calculated:nji , + 1 pRpRc ji , + 1 = ⋅ = x ji , + 1 ⋅ , (30)nRi , + 1 RT ⋅ RT ⋅where the pressure on the retentate side was heldat constant value p R = 50 bar. The partial H 2pressure on the retentate side was calculated as:p = x ⋅ p(31)RH2, i+ 1 RH2, i+1 R .In order to calculate heat duty the heat <strong>of</strong>reaction DH R needs to be calculated. This wasdone by using the van’t H<strong>of</strong>f Relation based onsource [6]:2 ∂∆HR=−R⋅T⋅ ln Keq( T, p ), (32)∂Twhere the logarithm <strong>of</strong> equilibrium constantK eq was obtained with the equation reported inBustamante [10] which was based on the studyfrom Singh and Saraf [7]:⎛ 9998.22 ⎞⎜ − 10 . 213 +T⎟⎜⎟ln K. Teq = 1.⋅ −3⎜ + 2 7456⋅10⋅ − ⎟.(33)1 987 ⎜−6 ⎜ −0.453⋅10⋅T2 ⎟− ⎟⎜⎝ −0. 201⋅lnT⎟⎠And the CO conversion X CO was deducedas follows:nCO, in − nCO,i+1XCO,i+1 =. (34)nCO,inb) Permeate side:Similarly as on the retentate side the Law<strong>of</strong> Conservation <strong>of</strong> Mass must also apply <strong>for</strong> eachsection on the permeate side. The molar flow <strong>of</strong>H 2 and N 2 mixture was calculated as:nPi , + 1 = nPi , −nH 2, i+1.(35)Because the molar flow <strong>of</strong> the N 2 sweepinggas is constant throughout the reactor, the molarflow <strong>of</strong> H 2 on the permeated side can be writtenas:n = n − n(36)PH2, i+ 1 Pi , + 1 N2.Samilarly as on the retentate side, themolar fraction <strong>of</strong> each species was calculatedusing the Eq.:nji , + 1x ji , + 1 = ,(37)nRi , + 1where j represents individual specie (H 2 or N 2 ).The partial H 2 pressure on the permeateside was calculated as:pPH2, i+ 1 = xPH2, i+1⋅ pP. (38)where the pressure on the permeate side was heldat the constant value p P = 1 bar.2.3 Model Design in Aspen PlusThe simulation was per<strong>for</strong>med using theAspen Plus reactor model unit where chemicalreactions <strong>of</strong> WGS and side reactions (H 2 S andCOS <strong>for</strong>mation) were modelled. The inputdata were temperature, pressure, molar flow,composition <strong>of</strong> syngas and <strong>for</strong>mulas <strong>of</strong> chemicalreactions that take place inside the reactor. Theshortcoming <strong>of</strong> the model was that the programhad no in<strong>for</strong>mation about the kinetics <strong>of</strong> the WGSRand hence no knowledge <strong>of</strong> the extent <strong>of</strong> the COconversion and the H 2 permeation through themembrane. These two parameters were calculatedbased on the kinetics <strong>of</strong> the WGSR and importedfrom Mathematica (see Fig. 4). That gave us moreaccurate predictions <strong>of</strong> the molar flow <strong>of</strong> H 2 in thepermeate stream and the achieved CO conversion918 Lotrič, A. ‒ Sekavčnik, M. ‒ Kunze, C. ‒ Splieth<strong>of</strong>f, H.
Strojniški vestnik - Journal <strong>of</strong> Mechanical Engineering 57(2011)12, 911 -926in the WGSMR. Based on these two parametersand the initial and boundary conditions (seesubchapter 2.1) the simulation <strong>of</strong> the WGSMRwas per<strong>for</strong>med.The model <strong>of</strong> the MR was designed toachieve the isothermal temperature distributionthroughout the entire reactor. This is done insuch a way that indirect water cooling is appliedin a co-current direction to syngas flow. To attainefficient heat removal, the water evaporatesalmost throughout the entire reactor and getsslightly superheated at the end <strong>of</strong> the reactor. It ispresumed that the WGSR will be most intensive atthe beginning <strong>of</strong> the reactor thus, most <strong>of</strong> the heatwill be released in the first part <strong>of</strong> the reactor. Thesweeping N 2 gas enters the reactor in a countercurrentway. The reason <strong>for</strong> that is to keep the H 2partial pressure difference reasonably high in allparts <strong>of</strong> the reactor in order to achieve better fluxthrough the reactor’s membrane.3 RESULTS AND DISCUSSION3.1 Calculations in MathematicaIn the subchapters bellow the WGSRkinetics are discussed and calculations <strong>for</strong> the basecase model are presented. A sensitivity analysis <strong>of</strong>the model is made by varying different parameterslike the membrane’s permeance, length (indirectlythe surface area) <strong>of</strong> the reactor and the molarfraction <strong>of</strong> H 2 in the permeate stream.3.1.1 WGSR KineticsThere is some discrepancy between theuncatalysed WGSR kinetic data available fromliterature. For this purpose, three different studieswere compared all using the Brad<strong>for</strong>d mechanism[4] to describe the WGSR. Table 2 presentsactivation energies and pre-exponential factorsobtained from these studies.The rate coefficients <strong>for</strong> <strong>for</strong>ward andbackward reaction were calculated according toEq. (3). As shown in Table 2, the rate coefficientscalculated with values obtained from Bustamante[10] are one order smaller than those obtainedwith values from Graven and Long [9]. Eventhough Bustamante’s research [10] was conductedat elevated pressures (16.21 bar), and Graven andLong’s [9] only at atmospheric pressure, the resultsfrom Graven and Long’s study [9] are in betteragreement with Culbertson [8] who conducted hisstudy at even higher pressures and temperatures(196.5 to 496.4 bar and 1200 to 2100 K).The calculations showed that the reactionrate according to Bustamante [10] is one ordersmaller than the one predicted from Graven andLong [9] (see Fig. 7). This has also been confirmedin the study from Culbertson [8], there<strong>for</strong>e thedecision was made that the coefficients deducedfrom Graven and Long [9] will be used in theWGSR kinetic study.3.1.2 Base Case StudiesOne <strong>of</strong> the purposes <strong>of</strong> this study was todetermine if the permeation through the membraneis sufficient or if there is a build-up <strong>of</strong> H 2 on theretentate side. First, the comparison was made byusing the molar flows <strong>of</strong> both processes calculatedby Eqs. (26) and (27).Only in the first two sections the reactionrate is slightly faster than the permeation (on Fig.a) Bustamante’s model b) Graven & Long’s modelFig. 7. Rate <strong>of</strong> reaction based on different models<strong>Simulation</strong> <strong>of</strong> <strong>Water</strong>-<strong>Gas</strong> <strong>Shift</strong> <strong>Membrane</strong> <strong>Reactor</strong> <strong>for</strong> <strong>Integrated</strong> <strong>Gas</strong>ification Combined Cycle Plantwith CO 2 Capture919
Strojniški vestnik - Journal <strong>of</strong> Mechanical Engineering 57(2011)12, 911-9268 the difference is negative) after which the rate<strong>of</strong> permeation becomes faster than the production<strong>of</strong> H 2 . As seen from Fig. 8, the maximumdifference is reached around the 400 th sectionand the permeation rate becomes almost equal tothe reaction rate around the 4000 th section. Therate <strong>of</strong> reaction rises slightly at the end becauseat that point the concentration <strong>of</strong> H 2 is closeto zero and the effect <strong>of</strong> the backward WGSRalmost disappears. The increase in the reactionrate also causes the rate <strong>of</strong> permeation to increase,because more H 2 is produced, which immediatelypermeates through the membrane because theprocess is not permeation limited.in the retentate stream at the beginning and H 2converted from CO until that point permeatethrough the membrane. From that point on, onlythe H 2 that is converted from CO is permeatingthrough the membrane.Rapid permeation <strong>of</strong> H 2 is responsible <strong>for</strong>molar fractions <strong>of</strong> H 2 O and CO to experiencethe first inflection point around the 400 th section.The fractions reach the second inflection pointaround 2000 th section, where majority <strong>of</strong> H 2 onthe retentate side already permeated through themembrane. From that point on both fractionsgradually reduce towards the end <strong>of</strong> reactor wherethe consumption <strong>of</strong> H 2 O and CO again slightlyincreases on behalf <strong>of</strong> increase in the reaction rate.The molar fraction <strong>of</strong> CO 2 is increasing fastin the first 2000 sections because <strong>of</strong> H 2 permeationand because <strong>of</strong> CO conversion. This can be seenfrom a graph where after 2000 sections the rate <strong>of</strong>CO 2 <strong>for</strong>mation starts to decrease since virtuallyall <strong>of</strong> H 2 that was present in the stream permeatesthrough the membrane. At the end, the rate <strong>of</strong>CO 2 <strong>for</strong>mation slightly increases on behalf <strong>of</strong> theincrease in the reaction rate.Fig. 8. Difference between the rate <strong>of</strong> H 2production and the rate <strong>of</strong> H 2 permeation in eachsection <strong>of</strong> the reactorAs it can be seen from Fig. 9, the molarfraction <strong>of</strong> H 2 actually rises at the beginning eventhough the rate <strong>of</strong> permeation is greater as the rate<strong>of</strong> <strong>for</strong>mation. By constantly extracting H 2 fromthe retentate stream, the joint molar flow alsodecreases. Since at the beginning the differencebetween the permeation and the production rates<strong>of</strong> H 2 is not big enough, the H 2 molar flow inretentate stream is decreasing but not as fast as themolar flows <strong>of</strong> H 2 O and CO. As a consequence,the molar fraction <strong>of</strong> H 2 actually rises slightlyuntil the 64 th section where, on behalf <strong>of</strong> a sharpincrease in the permeation rate, H 2 starts to rapidlypermeate through the membrane.After reaching the peak at the 64 th sectionthe molar fraction <strong>of</strong> H 2 starts to decrease fastuntil the 1000 th section. Around the 2000 th sectionthe permeation already slows down considerablyand around the 4000 th section most <strong>of</strong> H 2 presentFig. 9. Change in molar fractions <strong>of</strong> species andthe CO conversion throughout the reactorBased on the input values, the calculatedmolar composition <strong>of</strong> the retentate stream ispresented in Table 3. Below, these values are alsocompared to the simulation results from AspenPlus.In order to keep the MR operating atisothermal conditions, approximately two thirds<strong>of</strong> all heat, produced from the WGSR, would needto be removed from the reactor in the first 2000sections (see Fig. 10). The cooling tubes should bedistributed in such a way that they would insure920 Lotrič, A. ‒ Sekavčnik, M. ‒ Kunze, C. ‒ Splieth<strong>of</strong>f, H.
Strojniški vestnik - Journal <strong>of</strong> Mechanical Engineering 57(2011)12, 911 -926the reactor to operate at isothermal conditions andto prevent the <strong>for</strong>mation <strong>of</strong> any hotspots in thereactor.Table 3. Input and output values from MathematicaprogramInput values (SYNGAS)species H 2 O CO H 2 CO 2 inertx i 0.410 0.375 0.154 0.052 0.009Output values (GAS-2)species CO 2 H 2 O CO inert H 2x i 0.754 0.148 0.080 0.018 3.0∙10 -4600 sections. Beyond that point permeation isfaster but it remains fairly low. At the beginningpermeation slightly rises because <strong>of</strong> the H 2 buildupwhich increases the H 2 partial pressure andenhances the flux through the membrane. TheWGSR proceeds fast in the first 1000 sections andthen it remains low through the entire reactor. Theblue, dashed line shows the difference betweenboth processes.It should also be noted that by introducingthe cooling tubes into the reactor the COconversion may suffer minor penalties because thereaction volume <strong>for</strong> the WGSR will be reduced.The shape <strong>of</strong> the curve resembles the curve<strong>of</strong> the CO conversion, because with more COconverted more heat is released. The calculatedcumulative heat duty released from the WGSR isQ = 63.4 MW.Fig. 11. Difference between the rate <strong>of</strong> H 2production and the rate <strong>of</strong> H 2 permeation withone order smaller permeanceFig. 10. Cumulative distribution <strong>of</strong> heat releasedin the WGSMRThe graph in Fig. 12 shows the build-up<strong>of</strong> H 2 molar fraction in the retentate stream. Afterthe reaction rate becomes steady, the H 2 fractionstarts to gradually decrease on behalf <strong>of</strong> slowpermeation. As the permeation is very limited,all <strong>of</strong> H 2 does not succeed in permeating throughthe membrane, there<strong>for</strong>e in the end there is stillaround 4% <strong>of</strong> H 2 left in the retentate stream.3.1.3 Influence <strong>of</strong> <strong>Membrane</strong>’s Permeance on COConversionThe influence <strong>of</strong> membrane’s permeanceon the CO conversion was studied using the MRdesigned <strong>for</strong> base case studies. The only parameterthat was changed was the membrane’s permeance.In this analysis the permeance was set to the valuek′ = 3·10 -5 mol m -2 s -1 Pa -0.5 . The calculationsshow that in the MR with such material permeancethe processes would become permeation limited.The graph in Fig. 11 shows that the reactionrate is faster than the permeation rate in the firstFig. 12. Change in molar fractions <strong>of</strong> speciesand the CO conversion with one order smallerpermeance<strong>Simulation</strong> <strong>of</strong> <strong>Water</strong>-<strong>Gas</strong> <strong>Shift</strong> <strong>Membrane</strong> <strong>Reactor</strong> <strong>for</strong> <strong>Integrated</strong> <strong>Gas</strong>ification Combined Cycle Plantwith CO 2 Capture921
Strojniški vestnik - Journal <strong>of</strong> Mechanical Engineering 57(2011)12, 911-926The reactor achieves only 50% COconversion because the extraction <strong>of</strong> H 2 is tooslow and it does not shift the equilibrium as far tothe product side as in the base case scenario.3.1.4 Influence <strong>of</strong> <strong>Reactor</strong>’s Surface Area andH 2 Molar Fraction in Permeated Stream on COConversionThe influence <strong>of</strong> the reactor’s surface areaon CO conversion was studied by varying thelength <strong>of</strong> the reactor. Additionally, the influence<strong>of</strong> different molar compositions in the permeatestream was studied. By changing both parametersTable 4 was obtained.The table shows that reducing the molarfraction <strong>of</strong> H 2 in the permeate stream wouldfavour the CO conversion. This is due to the factthat the partial pressure <strong>of</strong> H 2 is lower and thus,enhances the flux through the membrane whichindirectly affects the CO conversion.Increasing the reactor’s surface, byextending the length <strong>of</strong> the reactor, also favoursthe CO conversion. By enlarging the membranesurface area, more H 2 can permeate through,which shifts the WGSR more to the product side,and helps improve the CO conversion.To further determine the influence <strong>of</strong>surface area, the reactor with 70 m in length andH 2 molar fraction x H2 = 0.45 was simulated. Thereactor achieved only 92.3% CO conversion. Thisshows that extending a reactor further would helpachieve better conversions, but from economicpoint <strong>of</strong> view investment costs would be enormousto build such a big reactor. As discussed in earlierchapters, it would be better to use the catalystbecause the surface area is already large enoughand in the latter part <strong>of</strong> the MR the limitingprocess is the WGSR rate.3.2 <strong>Simulation</strong> Results in Aspen PlusThe model simulated on the basis <strong>of</strong> thecalculations obtained from the Mathematica basecase model is presented in the previous subchapter.Table 4. CO conversion at different H 2 molar fractions and lengths <strong>of</strong> reactorL = 30 m L = 40 m L = 50 mX COn N2[mol/s]n P,H2[mol/s]X COn N2[mol/s]n P,H2[mol/s]X COn N2[mol/s]n P,H2[mol/s]x H2 0.5 87.0 2664.53 2664.49 89.1 2707.63 2707.57 90.2 2730.35 2730.30.45 88.0 3281.43 2684.73 90.1 3335.05 2728.57 91.2 3363.35 2751.820.55 86.0 2162.35 2642.9 88.0 2196.87 2685.16 89.1 2215.03 2707.32Table 5. Molar compositions <strong>of</strong> gas streams(see Fig. 13)Rawgas (on the exit from the gasifier)species CO H 2 H 2 O CO 2 Ar H 2 S N 2 COS HClx i 0.560 0.230 0.120 0.077 4.8∙10 -3 4.5∙10 -3 4.0∙10 -3 3.9∙10 -4 6.7∙10 -5Syngas (after quench)species H 2 O CO H 2 CO 2 Ar H 2 S N 2 COS HClx i 0.410 0.375 0.154 0.052 3.2∙10 -3 3.0∙10 -3 2.7∙10 -3 2.6∙10 -4 4.5∙10 -5<strong>Gas</strong>-2 (retentate stream on the exit <strong>of</strong> the MR)species CO 2 H 2 O CO Ar H 2 S N 2 H 2 COS HClx i 0.769 0.140 0.072 6.3∙10 -3 5.9∙10 -3 5.3∙10 -3 5.3∙10 -4 5.2∙10 -4 8.8∙10 -5<strong>Gas</strong>-3 (after catalytic burner)species CO 2 H 2 O SO 2 Ar N 2 O 2 CO H 2 H 2 Sx i 0.835 0.146 6.4∙10 -3 6.2∙10 -3 5.2∙10 -3 2.0∙10 -3 0 0 0GT-gas (permeate stream on the exit <strong>of</strong> the MR)species H 2 N 2 CO H 2 O CO 2 Ar H 2 S COS HClx i 0.5 0.5 0 0 0 0 0 0 0922 Lotrič, A. ‒ Sekavčnik, M. ‒ Kunze, C. ‒ Splieth<strong>of</strong>f, H.
Strojniški vestnik - Journal <strong>of</strong> Mechanical Engineering 57(2011)12, 911 -926This chapter deals with the influence <strong>of</strong> absolutepressure on the permeate side as regards to thepower demand <strong>for</strong> compression <strong>of</strong> H 2 /N 2 mixture.3.2.1 Base Case StudiesThe input variables <strong>for</strong> the simulation inAspen Plus were the same as the values <strong>for</strong> modelin Mathematica. The only additional data thatthe model in Aspen needed were the values <strong>for</strong>CO conversion and the molar flow <strong>of</strong> permeatedH 2 . On the basis <strong>of</strong> the simulation, the molarcompositions <strong>of</strong> gas streams were obtained (seeTable 5). The other calculated data are presentedin the flowsheet diagram presented in Fig. 13.The molar fraction <strong>of</strong> CH 4 was left out<strong>of</strong> this table because the gasifier model in AspenPlus predicts that only a small fraction <strong>of</strong> methanex CH4 =3.8·10 -5 is <strong>for</strong>med.The values predicted from the simulation inAspen Plus and the calculations from Mathematicaare in good agreement. In general, the model inAspen predicts that more CO should be converted<strong>for</strong> a given CO conversion, because the fractions<strong>of</strong> CO 2 and H 2 are slightly higher and the fractions<strong>of</strong> CO and H 2 O are slightly smaller as predicted inMathematica. The calculated heat duty is in verygood agreement between both models.At the exit <strong>of</strong> the catalytic burner, thetemperature <strong>of</strong> CO 2 rich stream reaches 1200 °C;there<strong>for</strong>e, there is a great amount <strong>of</strong> heat available<strong>for</strong> other processes. A considerable amount <strong>of</strong> SO 2present in the stream can be cleaned <strong>of</strong> sulphurusing the conventional Flue gas desulphurisation(FGD) technologies. At this point it should bementioned that the MR can also be used <strong>for</strong> directthermal decomposition <strong>of</strong> H 2 S. Studies on thistopic have already been conducted by severalauthors [12] to [14] and this could be one <strong>of</strong> thefuture features integrated in the WGSMR.3.2.2 Influence <strong>of</strong> Absolute Pressure on PowerDemand <strong>for</strong> CompressionThe influence <strong>of</strong> the absolute pressureat the permeate side on the power demand <strong>for</strong>compression <strong>of</strong> H 2 and N 2 mixture was studied atthree different pressures and at constant H 2 molarfraction x H2 = 0.5.The change in the absolute pressure on thepermeate side effects the H 2 permeation throughthe membrane because the partial pressure is alsochanged. As a consequence different H 2 molarflows on the exit <strong>of</strong> the MR are obtained. Toadequately compare the power demand at differentoperating conditions, the specific work w comp wasintroduced and defined as:Fig. 13. Flowsheet diagram used <strong>for</strong> WGSMR simulations<strong>Simulation</strong> <strong>of</strong> <strong>Water</strong>-<strong>Gas</strong> <strong>Shift</strong> <strong>Membrane</strong> <strong>Reactor</strong> <strong>for</strong> <strong>Integrated</strong> <strong>Gas</strong>ification Combined Cycle Plantwith CO 2 Capture923
Strojniški vestnik - Journal <strong>of</strong> Mechanical Engineering 57(2011)12, 911-926wcompPcomp= , (39)n where P comp is the joint power demand <strong>of</strong> all stagesand n P the molar flow <strong>of</strong> the permeate stream. Thecalculated data are presented in Table 6.Table 6. Comparison <strong>of</strong> specific work <strong>for</strong>compression <strong>of</strong> H 2 to 26 barp [bar] 1 2 3P comp [MW] 68.497 51.127 45.475n P [mol/s] 5415.2 5222.2 5075.6w comp [kJ/mol] 12.65 9.79 8.96The calculated data show that specificpower demand <strong>for</strong> the base case (1 bar) isrelatively high compared to other two cases. Incases <strong>of</strong> 2 and 3 bar the power demand is notthat different; there<strong>for</strong>e, operating at 2 bar wouldbe an inviting option. In the future, it wouldbe reasonable to study the trade-<strong>of</strong>f betweenthe higher H 2 production and the lower powerconsumption <strong>for</strong> compression.P4 CONCLUSIONSThe WGSR kinetics was described withBrad<strong>for</strong>d mechanism [4] together with thekinetic data obtained from Graven and Long’s [9]experimental results. The calculations per<strong>for</strong>medin Mathematica were used to calculate the COconversion and the H 2 flux through the membrane.The calculated data were then imported in AspenPlus as input (or initial) values <strong>for</strong> simulations.The model in Aspen Plus was designed as ablack box model, simulating the processes basedon the initial and boundary conditions and thecalculations obtained from Mathematica. Theresults, derived from both models, are in goodagreement with each other and support thecorrectness <strong>of</strong> the designed model.Based on the operational conditions <strong>of</strong>the designed reactor the membrane materialbased on Pd was selected. The calculations showthat the membrane material with permeancek′ = 3·10 -4 mol m -2 s -1 Pa -0.5 . would be sufficient<strong>for</strong> the CO conversion because the process wouldbe reaction and not permeation limited. The COconversion could be enhanced by increasing thereaction rate with the use <strong>of</strong> high temperaturecatalyst or with higher process temperatures.Other studies emphasized that Pd also has somecatalytic properties <strong>for</strong> the WGSR but this wasnot included in the designed model. However, inthe future it would be reasonable to determine thecatalytic properties <strong>of</strong> Pd to accurately predict theWGSR rate, as well. It was established that oneorder smaller membrane permeance would reducethe CO conversion to 50% because the processwould be permeation limited.Based on the selected boundary conditionsthe designed model predicts that 89.1% COconversion can be achieved. With length increase<strong>of</strong> 75% and H 2 molar fraction <strong>of</strong> x H2 = 0.45 in thepermeate stream 92.3% conversion was achieved.But from economic point <strong>of</strong> view the gain in COconversion would not justify the investment cost<strong>for</strong> such a big reactor.Changing the absolute pressure on thepermeate side shows that the trade-<strong>of</strong>f betweenthe CO conversion and the power demand <strong>for</strong>compression <strong>of</strong> H 2 /N 2 gas stream needs to beapproached by further research. The specificpower demand shows that it would be reasonableto set the absolute pressure to 2 bar.The retentate stream is fed to the catalyticburner, where the unconverted CO, unpermeatedH 2 and H 2 S are burned to produce additional heat.Afterwards, the stream contains the SO 2 which canbe removed with conventional FGD technologies.Another possibility <strong>for</strong> the MR in the future maybe the thermal decomposition <strong>of</strong> H 2 S. However,in order to incorporate the process into the MR, itneeds to be studied further.In general, the study shows that theWGSMR is feasible, but there are still manyissues that need to be addressed. First <strong>of</strong> all, themembrane material must retain its structuralstability and permeability during the operatingconditions that are stated. If the material cannotwithstand the acid environment, pre-cleaning <strong>of</strong>syngas would be needed. Proper cooling <strong>of</strong> thereactor also needs to be designed to avoid hotspotsand to keep the reactor operating at isothermalconditions. By introducing cooling tubes intothe reactor, the CO conversion may suffer minorpenalties because less reaction volume will beavailable <strong>for</strong> the WGSR to take place.924 Lotrič, A. ‒ Sekavčnik, M. ‒ Kunze, C. ‒ Splieth<strong>of</strong>f, H.
Strojniški vestnik - Journal <strong>of</strong> Mechanical Engineering 57(2011)12, 911 -9265 ACKNOWLEDGEMENTThe authors would like to thank thereviewers <strong>for</strong> their constructive criticism, whichhelped to improve the quality and understanding<strong>of</strong> this article.6 NOMENCLATUREGeneral acronymsASU Air Separation UnitCCS Carbon Capture and StorageFGD Flue <strong>Gas</strong> DesulphurisationIGCC <strong>Integrated</strong> <strong>Gas</strong>ification Combined CycleMR <strong>Membrane</strong> <strong>Reactor</strong>PSA Pressure Swing AdsorptionWGS <strong>Water</strong>-<strong>Gas</strong> <strong>Shift</strong>WGSR <strong>Water</strong>-<strong>Gas</strong> <strong>Shift</strong> ReactionWGSMR <strong>Water</strong>-<strong>Gas</strong> <strong>Shift</strong> <strong>Membrane</strong> <strong>Reactor</strong>Physical quantities2r Outer diameter <strong>of</strong> tubular membrane, [m][A] Concentration, [mol/m 3 ]a Partial order <strong>of</strong> reactiona Width and height <strong>of</strong> MR, [m]c Molar concentration, [mol/m 3 ]∆A <strong>Membrane</strong>’s surface area <strong>of</strong> infinitesimalsection, [m 2 ]∆H R Heat <strong>of</strong> reaction, [J/mol]∆V Volume surrounding infinitesimal section<strong>of</strong> the membrane, [m 3 ]∆x Length <strong>of</strong> infinitesimal section, mE a Energy <strong>of</strong> activation, [J/mol]E abEnergy <strong>of</strong> activation <strong>for</strong> backwardWGSR, [J/mol]E afEnergy <strong>of</strong> activation <strong>for</strong> <strong>for</strong>ward WGSR,[J/mol]i index representing the i th section innumerical calculationsj index representing individual gas specieJ Flux through membrane, [mol/(m 2 s)]k Rate constant, [(cm 3 /mol) 0.5 s -1 ]k b Rate constant <strong>for</strong> backward WGSR,[(cm 3 /mol) 0.5 s -1 ]k f Rate constant <strong>for</strong> <strong>for</strong>ward WGSR,[(cm 3 /mol) 0.5 s -1 ]k 0 Pre-exponential factor, [(l/mol) 0.5 s -1 ]k 0b Pre-exponential factor <strong>for</strong> backwardWGSR, [(l/mol) 0.5 s -1 ]k 0f Pre-exponential factor <strong>for</strong> <strong>for</strong>wardWGSR, [(l/mol) 0.5 s -1 ]k’ <strong>Membrane</strong>’s permeance,[mol m -2 s -1 Pa -0.5 .]K eq Equilibrium constantL Length <strong>of</strong> reactor, [m]n Molar flow, [mol/s]n R Molar flow <strong>of</strong> retentate gas stream,[mol/s]n P Molar flow <strong>of</strong> permeate gas stream,[mol/s]n CO Molar flow <strong>of</strong> CO, [mol/s]n CO2 Molar flow <strong>of</strong> CO 2 , [mol/s]n H2 Molar flow <strong>of</strong> H 2 permeating throughmembrane, [mol/s]n H2O Molar flow <strong>of</strong> H 2 O, [mol/s]n inert Molar flow <strong>of</strong> inert gases, [mol/s]n N2 Molar flow <strong>of</strong> N 2 (carrier gas) onpermeate side <strong>of</strong> the membrane, [mol/s]n reaction Molar flow <strong>of</strong> species produced orconsumed during the WGSR, [mol/s]n PH2 Molar flow <strong>of</strong> H 2 on permeate side <strong>of</strong> themembrane, [mol/s]n RH2 Molar flow <strong>of</strong> H 2 on the retentate side <strong>of</strong>the membrane, [mol/s]N TUBES Number <strong>of</strong> tubes in MRp Pressure, [bar]p P Pressure on permeate side <strong>of</strong> MR, [bar]p PH2 Partial pressure <strong>of</strong> H 2 on permeate side<strong>of</strong> the membrane, [bar]p R Pressure on retentate side <strong>of</strong> MR, [bar]p RH2 Partial pressure <strong>of</strong> H 2 on retentate side <strong>of</strong>the membrane, [bar]P comp Power demand <strong>for</strong> H 2 compression, [W]Q Heat duty, [W]r Rate <strong>of</strong> reaction, [mol/(cm 3 s)]r b Rate <strong>of</strong> reaction <strong>for</strong> backward WGSR,[mol/(cm 3 s)]r f Rate <strong>of</strong> reaction <strong>for</strong> <strong>for</strong>ward WGSR,[mol/(cm 3 s)]R Universal gas constant, [J/(mol K)]T Temperature, [K]w comp Specific work <strong>for</strong> H 2 compression,[J/mol]x Molar composition or molar fractionx RH2 Molar fraction <strong>of</strong> H 2 on retentate side <strong>of</strong>the membranex PH2 Molar fraction <strong>of</strong> H 2 on permeate side <strong>of</strong>the membraneCO conversionX CO<strong>Simulation</strong> <strong>of</strong> <strong>Water</strong>-<strong>Gas</strong> <strong>Shift</strong> <strong>Membrane</strong> <strong>Reactor</strong> <strong>for</strong> <strong>Integrated</strong> <strong>Gas</strong>ification Combined Cycle Plantwith CO 2 Capture925
Strojniški vestnik - Journal <strong>of</strong> Mechanical Engineering 57(2011)12, 911-9267 REFERENCES[1] Donaldson, A.M., Mukherjee, K.K. (2006).<strong>Gas</strong> turbine “refueling” via IGCC POWERMagazine, from: http://www.powermag.com/gas/<strong>Gas</strong>-turbine-"refueling%22-via-IGCC_540_p3.html, accesed on 2009-06-14.[2] Ladebeck, J.R., Wagner, J.P. (2003). Catalystdevelopment <strong>for</strong> water-gas shift. Handbook <strong>of</strong>Fuel Cells - Fundamentals, Technology andApplications, vol. 3, part 2, p. 190-201.[3] Killmeyer, R., Rothenberger, K., Howard,B., Ciocco, M., Morreale, B., Enick, R.,Bustamante, F. (2003). <strong>Water</strong>-gas shiftmembrane reactor studies. US DOE, NETL,Berkeley.[4] Brad<strong>for</strong>d, B.W. (1933). The water-gasreaction in low-pressure explosions. Journal<strong>of</strong> the Chemical Society, p. 1557-1563,DOI 10.1039/jr9330001557.[5] Ciocco, M.V., Iyoha, O., Enick, R.M.,Killmeyer, R.P. (2007). High-temperaturewater-gas shift membrane study. NETL,South Park.[6] Lebon, G., Jou, D., Casas-Vazquez, J.(2008). Understanding Non-equilibriumThermodynamics: Foundations, Applications,Frontiers. Springer-Verlag, Berlin, DOI:10.1007/978-3-540-74252-4.[7] Singh, C.P., Saraf, D.N. (1977). <strong>Simulation</strong><strong>of</strong> high-temperature water-gas shift reactors.Industrial and Engineering Process Designand Development, vol. 16, no. 3, p. 313-319,DOI:10.1021/i260063a012.[8] Culbertson, B., Sivaramakrishnan, R.,Brezinsky, K. (2008). Elevated pressurethermal experiments and modeling studieson the water-gas shift reaction. Journal <strong>of</strong>Propulsion and Power, vol. 24, no. 5, p.1085-1092, DOI:10.2514/1.31897.[9] Graven, W.M., Long, J.F. (1954). Kinetics andmechanisms <strong>of</strong> the two opposing reactions <strong>of</strong>equilibrium CO + H 2 O = CO 2 + H 2 . Journal<strong>of</strong> the American Chemical Society, vol. 76, p.2602-2607, DOI:10.1021/ja01639a002.[10] Bustamante-Londono, F. (2004). The hightemperature,high-pressure homogeneouswater-gas shift reaction in a membranereactor. Ph.D. Thesis, University <strong>of</strong>Pittsburgh, Pittsburgh.[11] Enick, R., Bustamante, F., Iyoha, O., Howard,B., Killmeyer, R., Morreale, B., Ciocco, M.(2004). Conducting the homogeneous watergasshift reaction in a palladium/copper alloymembrane reactor at high temperature andpressure. NETL, Pittsburgh.[12] Edlund, D. (1996). A membrane reactor <strong>for</strong>H 2 S decomposition. Bend Research, Inc.,Morgantown.[13] Ma, Y. H., Moser, W.R., Pien, S., Shelekhin,A.B. (1994). Development <strong>of</strong> hollowfiber catalytic membrane reactors <strong>for</strong>high temperature gas cleanup. WorcesterPolytechnic Institute, Worcester.[14] US 7,163,670 B2 - Patent, Agarwal, P.K.,Ackerman, J. (2007). <strong>Membrane</strong> <strong>for</strong>Hydrogen Recovery from Streams ContainingHydrogen Sulfide, University <strong>of</strong> Wyoming,Wyoming.926 Lotrič, A. ‒ Sekavčnik, M. ‒ Kunze, C. ‒ Splieth<strong>of</strong>f, H.