Performance of microbial fuel cells with and without ... - ResearchGate
Performance of microbial fuel cells with and without ... - ResearchGate
Performance of microbial fuel cells with and without ... - ResearchGate

Create successful ePaper yourself
Turn your PDF publications into a flip-book with our unique Google optimized e-Paper software.
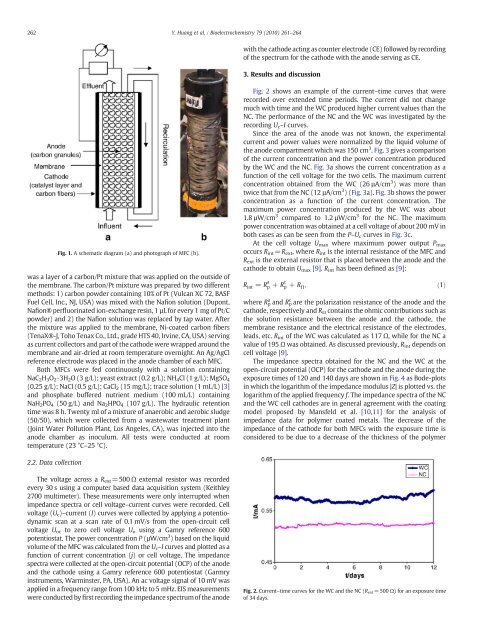
262 Y. Huang et al. / Bioelectrochemistry 79 (2010) 261–264<strong>with</strong> the cathode acting as counter electrode (CE) followed by recording<strong>of</strong> the spectrum for the cathode <strong>with</strong> the anode serving as CE.3. Results <strong>and</strong> discussionFig. 1. A schematic diagram (a) <strong>and</strong> photograph <strong>of</strong> MFC (b).was a layer <strong>of</strong> a carbon/Pt mixture that was applied on the outside <strong>of</strong>the membrane. The carbon/Pt mixture was prepared by two differentmethods: 1) carbon powder containing 10% <strong>of</strong> Pt (Vulcan XC 72, BASFFuel Cell, Inc., NJ, USA) was mixed <strong>with</strong> the Nafion solution (Dupont,Nafion® perfluorinated ion-exchange resin, 1 µL for every 1 mg <strong>of</strong> Pt/Cpowder) <strong>and</strong> 2) the Nafion solution was replaced by tap water. Afterthe mixture was applied to the membrane, Ni-coated carbon fibers(TenaX®-J, Toho Tenax Co., Ltd., grade HTS 40, Irvine, CA, USA) servingas current collectors <strong>and</strong> part <strong>of</strong> the cathode were wrapped around themembrane <strong>and</strong> air-dried at room temperature overnight. An Ag/AgClreference electrode was placed in the anode chamber <strong>of</strong> each MFC.Both MFCs were fed continuously <strong>with</strong> a solution containingNaC 2 H 3 O 2·3H 2 O (3 g/L); yeast extract (0.2 g/L); NH 4 Cl (1 g/L); MgSO 4(0.25 g/L); NaCl (0.5 g/L); CaCl 2 (15 mg/L); trace solution (1 mL/L) [3]<strong>and</strong> phosphate buffered nutrient medium (100 mL/L) containingNaH 2 PO 4 (50 g/L) <strong>and</strong> Na 2 HPO 4 (107 g/L). The hydraulic retentiontime was 8 h. Twenty ml <strong>of</strong> a mixture <strong>of</strong> anaerobic <strong>and</strong> aerobic sludge(50/50), which were collected from a wastewater treatment plant(Joint Water Pollution Plant, Los Angeles, CA), was injected into theanode chamber as inoculum. All tests were conducted at roomtemperature (23 °C–25 °C).Fig. 2 shows an example <strong>of</strong> the current–time curves that wererecorded over extended time periods. The current did not changemuch <strong>with</strong> time <strong>and</strong> the WC produced higher current values than theNC. The performance <strong>of</strong> the NC <strong>and</strong> the WC was investigated by therecording U c –I curves.Since the area <strong>of</strong> the anode was not known, the experimentalcurrent <strong>and</strong> power values were normalized by the liquid volume <strong>of</strong>the anode compartment which was 150 cm 3 . Fig. 3 gives a comparison<strong>of</strong> the current concentration <strong>and</strong> the power concentration producedby the WC <strong>and</strong> the NC. Fig. 3a shows the current concentration as afunction <strong>of</strong> the cell voltage for the two <strong>cells</strong>. The maximum currentconcentration obtained from the WC (26 µA/cm 3 ) was more thantwice that from the NC (12 µA/cm 3 )(Fig. 3a). Fig. 3b shows the powerconcentration as a function <strong>of</strong> the current concentration. Themaximum power concentration produced by the WC was about1.8 µW/cm 3 compared to 1.2 µW/cm 3 for the NC. The maximumpower concentration was obtained at a cell voltage <strong>of</strong> about 200 mV inboth cases as can be seen from the P–U c curves in Fig. 3c.At the cell voltage U max where maximum power output P maxoccurs R int =R ext , where R int is the internal resistance <strong>of</strong> the MFC <strong>and</strong>R ext is the external resistor that is placed between the anode <strong>and</strong> thecathode to obtain U max [9]. R int has been defined as [9]:R int = R a p + R c p + R Ω ;where R p a <strong>and</strong> R p c are the polarization resistance <strong>of</strong> the anode <strong>and</strong> thecathode, respectively <strong>and</strong> R Ω contains the ohmic contributions such asthe solution resistance between the anode <strong>and</strong> the cathode, themembrane resistance <strong>and</strong> the electrical resistance <strong>of</strong> the electrodes,leads, etc. R int <strong>of</strong> the WC was calculated as 117 Ω, while for the NC avalue <strong>of</strong> 195 Ω was obtained. As discussed previously, R int depends oncell voltage [9].The impedance spectra obtained for the NC <strong>and</strong> the WC at theopen-circuit potential (OCP) for the cathode <strong>and</strong> the anode during theexposure times <strong>of</strong> 120 <strong>and</strong> 140 days are shown in Fig. 4 as Bode-plotsin which the logarithm <strong>of</strong> the impedance modulus |Z| is plotted vs. thelogarithm <strong>of</strong> the applied frequency f. The impedance spectra <strong>of</strong> the NC<strong>and</strong> the WC cell cathodes are in general agreement <strong>with</strong> the coatingmodel proposed by Mansfeld et al. [10,11] for the analysis <strong>of</strong>impedance data for polymer coated metals. The decrease <strong>of</strong> theimpedance <strong>of</strong> the cathode for both MFCs <strong>with</strong> the exposure time isconsidered to be due to a decrease <strong>of</strong> the thickness <strong>of</strong> the polymerð1Þ2.2. Data collectionThe voltage across a R ext =500Ω external resistor was recordedevery 30 s using a computer based data acquisition system (Keithley2700 multimeter). These measurements were only interrupted whenimpedance spectra or cell voltage–current curves were recorded. Cellvoltage (U c )–current (I) curves were collected by applying a potentiodynamicscan at a scan rate <strong>of</strong> 0.1 mV/s from the open-circuit cellvoltage U oc to zero cell voltage U o using a Gamry reference 600potentiostat. The power concentration P (µW/cm 3 ) based on the liquidvolume <strong>of</strong> the MFC was calculated from the U c –I curves <strong>and</strong> plotted as afunction <strong>of</strong> current concentration (j) or cell voltage. The impedancespectra were collected at the open-circuit potential (OCP) <strong>of</strong> the anode<strong>and</strong> the cathode using a Gamry reference 600 potentiostat (Garmryinstruments, Warminster, PA, USA). An ac voltage signal <strong>of</strong> 10 mV wasapplied in a frequency range from 100 kHz to 5 mHz. EIS measurementswere conducted by first recording the impedance spectrum <strong>of</strong> the anodeFig. 2. Current–time curves for the WC <strong>and</strong> the NC (R ext =500 Ω) for an exposure time<strong>of</strong> 34 days.